
In today’s data-driven world, businesses and organizations are constantly looking for ways to leverage the vast amounts of data at their disposal to make informed decisions and gain a competitive advantage. This is where big data analytics comes in.
In this article, we’ll explore the how’s and why’s of big data analytics, looking at the 5 V’s of big data and the benefits and challenges of using big data in business.
Understanding Big Data and Data Analytics
The term “big data” means the huge volumes of unstructured or raw data from multiple sources. Later, it is analyzed for different business purposes, such as strategic decisions. Data analysis in business is a process of inspecting, cleansing, transforming, and modeling data with the goal of discovering useful information, informing conclusions, and supporting decision-making. Many data analytics techniques have been automated into mechanical algorithms that break down raw data for human consumption.
All types of information can be a subject of data analytics techniques and getting insights used to improve businesses. Analytics on big data reveals trends that would otherwise be lost in the mass of information. This information is used to increase the overall performance of systems.
For instance, the manufacturing industry often registers the downtime, runtime, and work queue for different machines. Then it analyzes the data to plan the workloads better, meaning those machines operate up to peak capacity. A business can also use data analytics to make more trustworthy business choices and analyze customer trends and satisfaction, which leads to new, improved products and services.
Big Data Value Chain
Data analysis suggests several different steps for processing big data:
-
Determining the data specifications. Data values may be numerical or divided by category, grouped by age, income, gender, etc.
-
Collecting big data via a variety of sources like computers, gadgets, cameras, environmental sources, sensors, etc.
-
Organization of data before it’s analyzed, which may be done on a spreadsheet or any other software that can take statistical data.
-
Cleaning the data up before analysis. It is checked to guarantee there are no errors and that it is complete.
There are four principal types of data analytics. While we divide them into categories, they are all linked and built upon each other. Moving from the simplest analytics to more complicated ones, the degree of complexity and resources needed rises. And so does the level of added insight and value.
-
Descriptive analytics explains what has happened over a given period.
-
Diagnostic analytics in big data focuses on why something occurred. It requires more diverse data inputs and a little bit of hypothesizing.
-
Predictive analytics can tell you what is going to happen in the near future.
-
Prescriptive analytics advises a plan of action.
All these types of data analysis are related and rely on one another to a certain degree. They all serve a particular purpose and provide different insights. Moving from descriptive analysis to predictive and prescriptive analysis demands much more technical expertise and unfastens more value for your business.
How it works: Key tools and technologies
When it comes to tools and technologies for big data analytics, we always mean several of them, often used together to collect, cleanse and analyze data. Here is the list of some of the main instruments we need to create big data ecosystems:
Databases:
-
Cassandra is a NoSQL database management system, which was designed to manage vast amounts of data. It is a free, open-source, distributed, wide-column store and offers support for clusters spanning various data centers.
-
MongoDB is an open-source, cross-platform document database that imposes very little but has drivers for various programming languages. Its flexibility and scalability make it an excellent tool when speed is required.
Processing:
-
Spark is used for real-time processing and analyzing massive amounts of data. Being open-source, this cluster computing framework applies implicit data parallelism and fault tolerance in order to provide an interface for programming entire clusters. Spark deals with streams and stream processing for faster computation.
-
Hadoop MapReduce, an open-source framework, helps in storing and analyzing big datasets. This software framework is used for easily writing applications that process vast amounts of data (multi-terabyte data-sets) in-parallel on large clusters (thousands of nodes) of commodity hardware in a reliable, fault-tolerant manner. It is free and can deal with vast amounts of both structured and unstructured data, which makes it really valuable for most big data operations.
Visualization:
-
Tableau is a broadly used business intelligence and analytics visualization software. Apart from visualizing, it can explore and securely share data in the form of Workbooks and Dashboards. Its drag-and-drop functionality is user-friendly and can be used by everyone to clean, analyze, and visualize the data quickly.
-
Power BI is a set of software applications, services, and connectors that work together to transform your unrelated sources of data into understandable, interactive, and visually appealing insights. Your data may be a spreadsheet, a set of cloud-based or on-premises hybrid data warehouses. Power BI allows its users to connect easily to your data sources, visualize and find what’s important, as well as share those insights.
ETL:
-
Talend Open Studio is an ETL tool used for data integration and management. It provides solutions for data preparation, quality, and integration, as well as for big data, application integration, and data management. Talend is built for cloud, multi-cloud, and hybrid environments. The enormous number of downloads and a full range of open-source integration data analytics software tools have made it the open-source leader in cloud and big data integration.
Why data quality is important
Talking about the insights and value you can acquire from data, one of the most valuable resources available, you need to remember that data is only helpful if it’s high-quality. Wrong type data is at best irrelevant. In the worst case, it may lead companies to make harmful mistakes. IBM concludes that bad data costs the American economy $3.1 trillion a year because employees should spend correcting bad data and because of errors causing mistakes with customers.
Improving the quality of your data is an ample opportunity. Let’s take a closer look at data quality and why it’s so important.
The factors that contribute to the quality of data include:
-
Accuracy
-
Validity
-
Completeness
-
Timeliness
-
Relevancy
-
Consistency
When the data you have meets all of those criteria, you can be sure it is high-quality.
From a financial viewpoint, keeping high levels of data quality allows you to reduce the cost of identifying and fixing bad data in your systems, avoid operational errors and business process breakdowns that can raise operating expenses and lower revenues.
Good data quality improves the accuracy of analytics applications, leading to better decision-making, improves internal processes.
5 V's of Big Data

The five V’s of big data are the five main and inherent attributes of big data. Knowing them enables data scientists to get more value from their data. It also allows the scientists to become more customer-centric.
Volume
Volume, first of the 5 V’s, relates to the amount of existing data. It’s like the foundation of big data, as it is the initial size and amount of collected data. If the volume is large enough, we can consider it to be big data, though it is pretty relative and can change depending on the computing power on the market. The volume of data that companies operate soared around 2012 when businesses started to accumulate more than 3 million pieces of data every day. This volume has been doubling about every 40 months since then.
Velocity
It indicates the speed of data generation and data flow. It’s vital for businesses that need a quick data flow, as it makes it possible for data to be at hand to make better decisions. The sources of data may vary from social media to machines, but no matter what it is, the data is digested and analyzed as quickly as in near real-time. Let’s take sensor data. The more the IoT takes off, the more connected sensors are out in the world. They transmit tiny bits of data at a near-constant rate. As the number of units rises, so does the flow. The flow of data is actually the velocity vector.
Variety
A company can get data from many different sources: from in-house devices, smartphones, social networks, etc. The significance of these sources of information differs depending on the type of the business. For instance, a mass-market service or product must be more aware of social networks than an industrial enterprise.
This data may have multiple layers with various values and is collected in plenty of different ways. For instance, various data-gathering tools, such as sensors, GPS, and cameras, are installed in vehicles in the automotive industry. After capturing real-time data insights from these tools, data is extracted and combined to provide services. These services allow telematic-service-providing companies, car insurers, and car leasing agencies to improve their performance.
Veracity
In this context, veracity is similar to quality. Ok, you have all the data, but could we miss something? Is it accurate? Collected data can have missing bits, might not be accurate, or may not provide real, relevant insight. Veracity, thus, refers to the level of trust in the collected data.
Data can also get messy and hard to use. Its large amount can cause more confusion than insights when it’s incomplete.
In insurance, there is always a tiny margin of error with substantial data sets, but working through them and still making the most accurate decisions achievable is key to leveraging big data. As in any industry, insurers need to apply a built-in skepticism to check their data and the insights it gives.
Value
Big data value relates to the application of collected data for your company. Regardless of its volume, data by itself usually isn’t beneficial — to make it valuable, we need to convert it into information or insights. By using processing software, you can receive useful insights from accumulated data, which can add value to your decision-making process.
Businesses can use the same tools to collect and analyze the data, but the way they derive value from it has to be unique.
Value and veracity help determine the quality of the insights received from big data.
Big Data in different industries
Having a look at big data applications in different businesses helps you better understand how to use it or how it is likely to be used in the future, in your trade, or across different industries.

These are some of the sectors where big data is used actively:
Manufacturing
Manufacturing industry generates large volumes of data, however the companies often failed in harnessing it full potential. Yet, However, with more affordable computing power and advanced analytics, process manufacturers can now turn this data into valuable insights. By gathering information from multiple data sources and applying machine learning models and visualization programs they can uncover new ways to optimize their processes from raw materials sourcing to the sale of finished products.
Using big data increases the uptime of critical assets in production to predict their failure. Predictive maintenance methods collect historical data to get insights that are invisible to conventional techniques. Businesses can now define the factors that may cause a machine to break and observe input parameters in order to intervene before the breakage. At least, they are ready to replace it, minimizing downtime. Predictive maintenance in manufacturing usually decreases machine downtime by 40 percent and extends machine life by 30 percent.

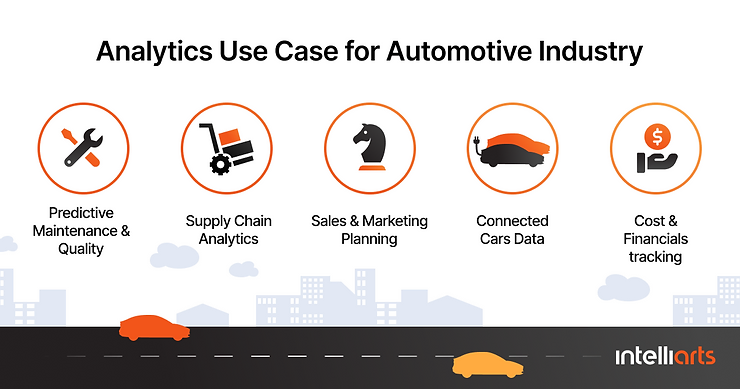
Automotive
Sensors throughout various vehicles gather valuable information capable of creating new insights into understanding driver behavior, car diagnostics, and location. Cars may now contain more than 50 sensors that collect speed, emissions, fuel consumption, and other types of data. It can later be used in machine learning to catch patterns for predictive analysis – to improve customer satisfaction, build smart cities, and resolve quality issues. We also can use analytics to improve customer satisfaction and quality management at a cost-efficient level. Predictive analysis and other forecasting tools decrease the risks of a product recall as well. Companies cooperate with authorities to predict congestion zones.
Read also: IoT in supply chain
On the other hand, prescriptive analytics optimizes production planning, scheduling, inventory, and supply chain logistics to meet company needs. Combining mathematical algorithms, big data analytics, machine learning, and artificial intelligence, a prescriptive analytics solution can advise the optimal action plan to reach particular business results. You may learn more details about big data in the automotive industry in our article about automotive data analytics.
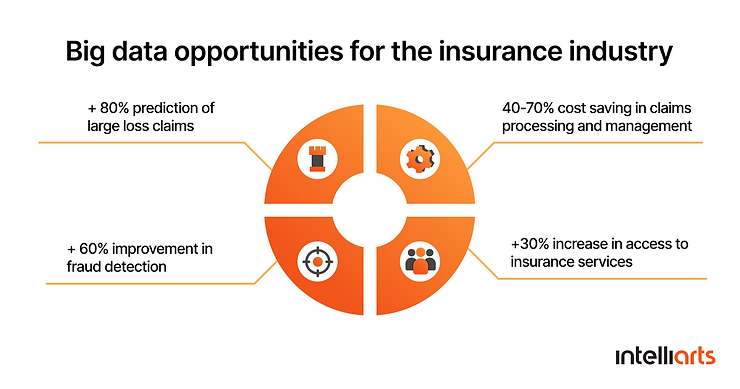
Insurance
Using machine learning in insurance, more than 2/3 of insurers believe predictive analytics reduce issues and underwriting expenses, and more than a half say the data they got has helped boost sales and profits. Predictive analytics tools can now gather data from various sources – internal and external – to interpret and predict the behavior of insureds. Insurance companies collect data from telematics, agent and customer interactions, smart homes, and even social media to understand and manage their relationships, claims, and underwriting.
One more related tool is predictive modeling, like using “what-if” modeling. It enables insurers to prepare for the underwriting workload, create data for filings, estimate the influence of a change on an insurer’s business. The COVID-19 situation showed that predicting change is invaluable, and “what-if” modeling is an excellent tool for carriers that understand they have to make changes but want to ensure they are doing it correctly. The proper predictive modeling in insurance software helps define and deliver price changes and new products more effectively.
Furthermore, machine learning for insurance fraud detection has become an indispensable tool, allowing insurers to identify and prevent fraudulent activities more accurately and efficiently, thus safeguarding their operations and financial health.
Banking and Securities
Banks, retail traders, hedge funds, and other businesses in the financial sector use big data for trade analytics with the application of sentiment measurement, high-frequency trading, pre-trade decision-support analytics, predictive analytics, etc.
The industry also relies on big data for risk analytics, including anti-money laundering, fraud mitigation, enterprise risk management, “Know Your Customer”, and so on.

Marketing
Various big data industry trends and applications show enormous potential for driving marketing influence in customer management. In many cases, big data analytics allows companies to monitor events in real-time and embed insights in real-time decision-making, making it an even more powerful tool. This leads to personalized, contextual, and dynamic decision recommendations to customers. Retailers use big data AI systems to collect information that can be recorded about user preferences, browsing history, purchasing behavior, etc. These sources are then converted into information and insights by intelligent machine-learning algorithms. It helps to identify customer interests and therefore predict customers’ needs. This data is later used for customer experience personalization, which saves customers’ time, increases their satisfaction, and leads to growth in the retailers’ income.

Healthcare
Some hospitals use data collected from phone applications from millions of patients to allow doctors to use evidence-based medicine, not just giving some tests to patients who go to the hospital, as a series of tests can be useful, but it can also be costly and ineffective.
Also, this information will allow doctors to compare this data in a socio-economic context and revise the delivery strategies respectively. Institutions use complex tools to monitor this massive data stream and react when the results are disturbing.
Some common healthcare use cases for machine learning are clinical decision support and the improvement of clinical care recommendations. For example, researchers have developed a medical machine learning algorithm to predict acute toxicities in radiation therapy patients. Deep learning identifies complicated patterns automatically and assists radiologists in making decisions by reviewing images such as radiographs, MRI, CT, and radiology reports. The performance of such diagnosis systems is equivalent to that of an experienced radiologist. Google ML applications were trained to detect breast cancer and achieved about 90% accuracy.

Big data applications might be used in almost every industry, and developing a data science strategy is crucial in leveraging big data for business insights and outcomes.
To read more on data analytics in the communication area, see our article about Applying Anomaly Detection to Improve 4G Networks).
Conclusion
Having looked at how big data plays a role in the industries above, here are a few key ideas. Here are key benefits from big data opportunities you will experience by applying analytics to your business:
-
Help your organization make better decisions
-
Find insights from data
-
Optimize & improving the customer experience
-
Predictive analytics
-
Mitigate risk and handle setbacks
-
Enhance security
If you’re interested in creating a Big Data savvy business, now is the time. Big data consulting experts from Intelliarts’ team are always here to help you. To learn more and overcome your competitors, feel free to reach out.

FAQ
1. Why is big data needed for machine learning?
Machine learning requires large amounts of data to train and learn on to make accurate predictions. Big data provides comprehensive information allowing algorithms to identify and learn patterns from this data.
2. How is big data analytics used in the manufacturing industry?
Within the manufacturing industry, big data analytics serves for the improvement of operational efficiency, optimizing production processes, minimizing downtimes, enhancing product quality, optimizing inventory and supply chain management, and making data-driven decisions.
3. What are the five use cases for big data in manufacturing?
The five essential use cases of big data in manufacturing are predictive maintenance, quality control, supply chain optimization, energy efficiency improvement, and product design enhancement.