Updated in December 2024
Electric vehicle (EV) charging data analytics is transforming the way EV businesses approach the management and performance of charging infrastructure. By improving operational efficiency, EV data analytics unlocks actionable insights that drive innovation and growth.
Drawing from our own experience working with a global EV company, this article delves into the practical applications of electric vehicle data analysis, highlighting key metrics to monitor and implementation challenges. Also, be sure to read the case study below to learn how Intelliarts helped to build a predictive maintenance analytics solution to help our partner improve the maintenance of EV charging stations and reduce the risk of downtime.
Get EV Charging to the Next Level
Explore how the top 10 EV tech trends are reshaping the e-mobility market.
Read the white paper
Top metrics to track for maximizing EV station efficiency
Effective optimization of EV charging stations requires careful monitoring and analysis of key performance metrics. Below are key metrics that electric vehicle data analytics can help businesses to keep track of:
- Charging station utilization rate to monitor the frequency of station use, understand demand patterns, and identify the locations that are underused — making analyzing data of EV usage crucial for operational insights
- Charging session duration to measure how long vehicles are connected to charging stations in order to optimize availability and reduce wait times
- Power consumption to track energy usage and detect inefficiencies or irregularities in station performance to grant more sustainable energy use
- Failure and maintenance logs to capture breakdowns, maintenance activities, and system reboots
- Availability status to provide real-time updates on whether a station is occupied or free to streamline user experience
- Anomalous behaviors to detect unexpectedly long charging sessions, unusual power levels, etc. to improve station efficiency
By identifying trends and defects in EV charging infrastructure, businesses can make more informed decisions and, hence, enhance operational efficiency and maintain a competitive edge in the EV charging data research firms.
How data analytics benefits EV station manufacturers

For EV station manufacturers, EV charging data analytics offers a transformative strategy to enhance their products and operations. Here are some of the key advantages:
- Improved station durability and design: Analytics provides valuable insights into recurring failures and user behaviors
- Optimized maintenance schedules: Manufacturers can replace costly reactive maintenance with predictive maintenance that minimizes downtime and extends equipment life
- Energy use improvements: Advanced analytics monitors and optimizes power usage patterns, reducing waste and cutting operational costs
- Business growth opportunities: Manufacturers gain strategic insights into market trends and station usage, allowing them to innovate faster
By harnessing the power of data, EV station manufacturers can position themselves as industry leaders, capable of addressing today’s challenges and anticipating future needs.
Keeping EV uptime through predictive maintenance
Delivering an exceptional user experience requires keeping EV stations in top condition and reducing downtime. However, EV chargers are at risk of breaking down at any moment, just like any other devices, resulting in inconvenience for the end-users.
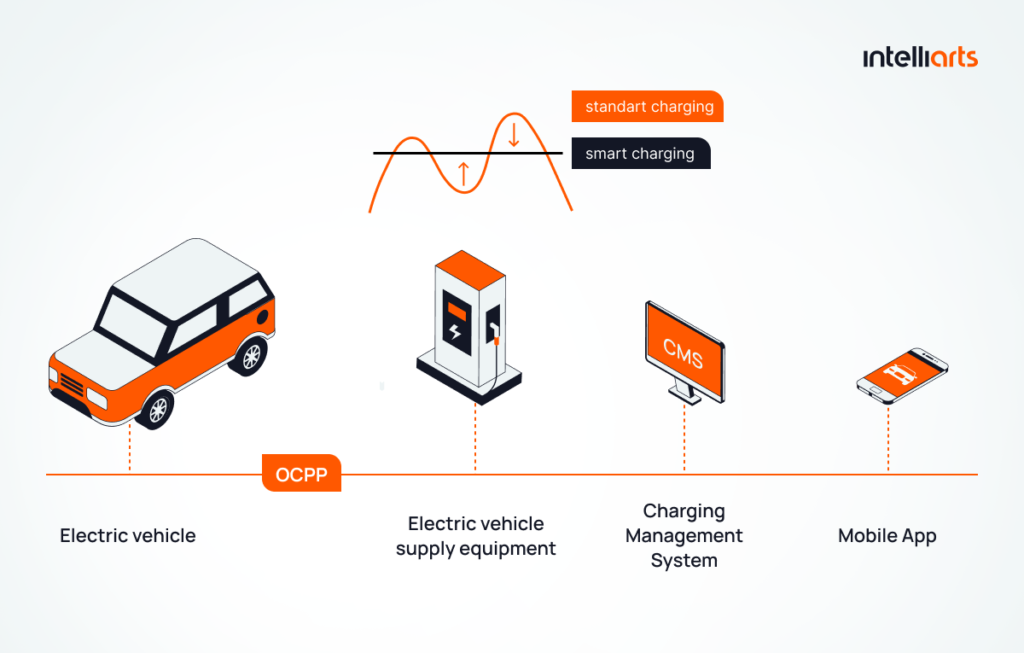
Modern EV charging stations operate through an open standard, and they are able to communicate with the network, providing information on charging sessions and the overall condition of each station. The standard is called the OCPP protocol – an application protocol for communication between an EV charging station and the central management system or a charging station network. The same principle as with cell phones and cell phone networks. Charging stations owners can change OCPP-based networks, but the protocol will always remain the same.
By applying machine learning algorithms, it becomes possible to analyze charging station data, detect anomalies, and predict potential failures. This allows operators to address issues before they escalate into significant problems, thus minimizing downtime and preventing costly damages. For example, supervised learning algorithms can be used to predict failures based on labeled datasets, while unsupervised algorithms help identify hidden patterns and anomalies in unlabeled data.
Data analytics is at the core of predictive maintenance, enabling EV station operators to anticipate issues and proactively resolve them. Insights derived from charging station data not only enhance EV charger efficiency but also ensure a seamless experience for end-users.
To learn more about how predictive maintenance can be implemented for EV stations, read our dedicated article: Predictive Maintenance for EV Stations.
Location optimization of EV chargers
Another use case is location-based EV charging optimization with data analytics. This is important for ensuring widespread accessibility of EV chargers and maximizing their efficiency.
By leveraging data-driven insights, operators can make informed decisions about where to install charging infrastructure. For instance, analysis of traffic flow patterns can help to identify areas where chargers are most likely to be used. Businesses can also prioritize locations based on user demand and charging habits, using location analytics to identify preferred charging times and durations. Demographic and geographic data can highlight underserved regions while environmental data such as proximity to renewable energy sources can support both operational efficiency and sustainability goals.
Using location intelligence for EV charging, operators can build an infrastructure that aligns with market demands while fostering the growth of the EV ecosystem.
Challenges of data analytics adoption in EV

Needless to say that adoption of data analytics in EV comes with a range of challenges, including:
- Data integration: EV operators often rely on data from diverse sources, including vehicle sensors, charging stations, energy grids, etc. Integrating this data into a unified system can be complex, especially when different data formats, protocols, and standards are involved.
- Data quality: Ensuring data quality and consistency is crucial for accurate analytics. Poor data quality can lead to inaccurate insights and suboptimal decision-making.
- Data overload and complexity: Without proper tools and frameworks in place, operators may struggle to extract actionable insights from data. Advanced analytics platforms are essential to filter out noise, focus on key metrics, and present data in an understandable way for decision-makers.
- Data privacy: Since the data generated by EVs is often sensitive and personal, it’s important to comply with regulations such as the GDPR or other local data protection laws. The risk of data breaches, cyberattacks, or unauthorized access can undermine consumer trust and damage a company’s reputation.
- Regulations and compliance: The EV sector is subject to various regulations that may affect how data is collected, analyzed, and used. Also, these regulations vary by country or region and may change over time, adding further complexity to data analytics implementation.
- Interoperability issues: Since it’s possible that different vendors develop different parts of the system, such as charging stations, energy management platforms, etc., operators have to make sure these are compatible with each other.
Implementing data analytics in electric vehicle charging
By implementing data analytics, EV businesses can significantly reduce downtime and optimize station performance. In the case study below, we describe the implementation of a machine learning-powered solution for predictive maintenance and anomaly detection for a global EV charging network company.
Business challenge
Our partner offers modern electric vehicle charging solutions with premium 24/7 customer service, including turnkey certified charging stations, a software platform with a wide variety of management features for businesses and organizations, and a trusted EV driver mobile application. By incorporating IoT in EV technologies, their solutions enable seamless integration of smart charging management, ensuring efficiency and adaptability for evolving market demands. Since its inception, the company gained the trust of its clients, proven market leaders in the automotive industry.
The EV company we partnered with, is always looking to keep user experience on the highest level, that’s why they constantly work on maintaining EV charging stations in top condition and reducing possible downtime.
In this case, we started with problem framing, which is very important to the success of a machine learning project. Here is a set of recommendations for business and tech experts if you are interested in more details. In our scenario, we agreed on:
- Articulating the problem (using predictive maintenance to determine when the station will break down)
- Looking for data for EV charging that was already labeled (finding out whether our partner already had labeled data suitable for a machine learning solution)
- Finding out that data comes directly from charging devices in EV stations
- Determining quantifiable outputs (as an output we agreed to expect the date when the station will go out of order)
Together with the customer, we decided that an ultimate goal for the ML project would be to implement a predictive maintenance solution for different EV charging stations they install for their clients. Only after precise problem framing we moved to electric vehicles and data analysis.
Solution: EV charging analytics software solution we made
After the series of meetings with Intelliarts, our partner made a strategic decision to perform a thorough predictive maintenance EV charging analysis first. For every project that relies on data, we use the CRISP-DM methodology, which we find more useful than analogs like KDD and SEMMA as it has a very important “Business Understanding” phase.
Here are the stages of CRISP-DM methodology:
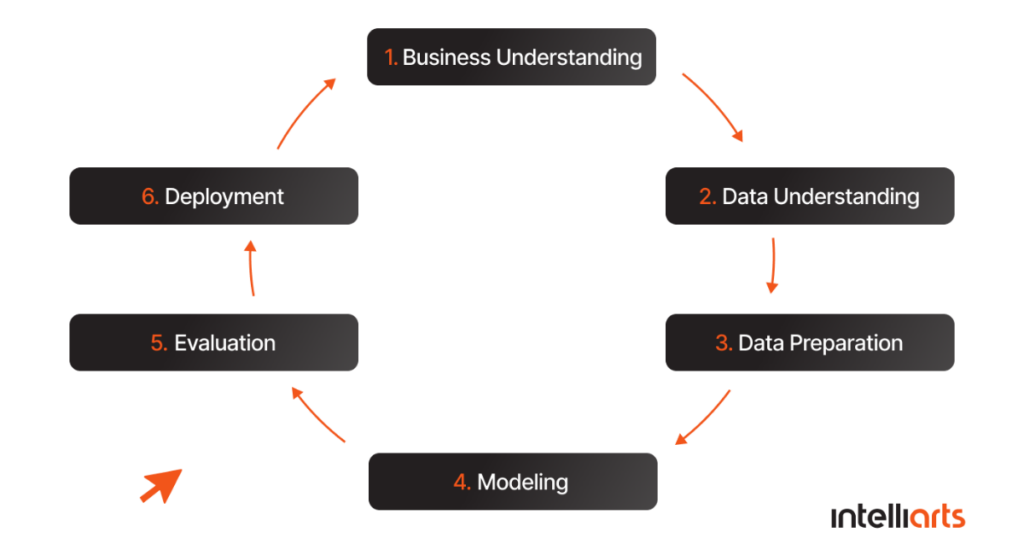
After defining the task which was possible to solve with machine learning, we moved on to understanding the data, according to this methodology.
There are three types of EV charging stations named L1, L2, and L3. They all differ in speed of charging. We received access to the database with the latest production updates. The data investigation was split into a high-level overview and a deep investigation. After two steps of data overview, we figured out that about a dozen of collections among a total of over a hundred were suitable for machine learning.
The EV charging company had records of the data for the period of five years:
-
25,000 records in 2015
-
50,000 records in 2016
-
150,000 records in 2017
-
300,000 records in 2018
-
550,000 records in 2019
-
1,000,000 records in 2020
After some research, we discovered that the data from the beginning of 2020 was the most suitable for this project, hence we selected it for further usage.
Our partner has business relationships with numerous vendors of the stations, so, as a first step, we decided to focus exclusively on the power Level 2 BTC stations. We made this decision due to the popularity of this vendor and the fact that the information was covered best for ML needs in the database. However, we still faced some major data labeling issues, which are common for projects of this kind:
-
Some stations had mismatched identifiers
-
In some cases, it was hard to distinguish between real sessions and fake or test ones
-
Charging session status was flagged as “Invalid” in a variety of situations, rather than having a particular status for each particular situation – because of that it was sometimes hard to distinguish what had really caused a charging session failure
-
If the power value was less than a certain number, the car was marked as fully charged
-
Two or more charging sessions were sometimes combined into one
-
The information about station reboots looked unrealistic in some cases
-
Some charging sessions had a start time bigger than a stop time
To sum it up, the quality of those data labels was not enough to create an effective ML-powered predictive maintenance solution that was planned initially. The biggest challenge was that the issues were reported manually anytime after the actual event (charging, breakdown, or maintenance) occurred. Because of that, the Remaining Useful Life (RUL), a subjective estimate of the remaining years and days of each component of the system, couldn’t be calculated precisely enough. The labels showing the maintenance mode of the station don’t always mean that the station was actually broken. In some cases, it was impossible to find out what actually caused the failure.
As the result of the initial data analysis, we understood that the labeling process requires significant improvement so that failed charging sessions have clear flags and distinct failure types, as ambiguous data don’t work for an efficient predictive maintenance data analysis solution. Ideally, the labeling process should be automated to minimize human interaction and reduce potential errors in the data collection flow. Other key factors for the realization of such a solution are collecting properly labeled data for at least 1 or 2 years, and improving the data collection pipeline.
The second goal was to implement an anomaly detection solution to detect abnormal behavior of the stations. We decided that the same data selection (information about BTC stations of level 2 in 2020) was a good place to start. The only features that described session behavior and could be used for anomaly detection were: power, charging time, parking time, and information about charging periods that took place during a charging session. Let’s take a look at the data from one of the charging stations and see what insights we might get out of it:

Energy distribution

Charging time between 50 and 3000 minutes
The most interesting thing we spotted after the analysis was that there were charging sessions with a really long duration, sometimes up to 30130 minutes, which could be considered an anomaly, and required further investigation. 10 kWh/hour power level was also a huge value for that kind of EV, so it required deeper investigation too. And there were other suspicious charging stations behaviors that we decided to investigate.
We used the following unsupervised anomaly detection algorithms to find anomalies:
-
DBSCAN (Density-Based Spatial Clustering of Applications with Noise), which is useful for finding arbitrary-shaped clusters and clusters with noise, also known as outliers. In this algorithm, if the point is close to many points of a particular cluster, it belongs to it. DBSCAN determines the number of clusters while detecting the outliers, it is very robust to outliers, performs well with arbitrary shape clusters, very effective when the distribution of values in the feature space cannot be assumed and works well in the multidimensional feature space for searching outliers. On the other hand, this algorithm requires powerful computing resources and is very sensitive to some parameters.
-
The isolation forest algorithm structures data points as nodes of an isolation tree while assuming that anomalies are rare events with feature values that differ a lot from expected data points. This is a precise and easy to optimize algorithm with a few parameters and is very effective when the distribution of values in the feature space cannot be assumed. However, when the algorithm isn’t optimized correctly, you can easily waste time on training and money on computing power.
-
The local outlier factor (LOF) gives an anomaly score for each data point. It is achieved by measuring the local density deviation of a given data point considering data points around it. This algorithm can work and provide great results out of the box for various domains, however, in higher dimensions the detection accuracy gets affected.

After the anomaly detection analysis, we saw that there were two normal clusters for two types of cars for the Level 2 EV charging stations. These stations sent a number of short charging sessions that could be considered abnormal. Additionally, there was information about the reboots of stations, but it was unclear what exactly caused them. We found two clusters with normal behavior and one cluster with abnormal behavior.
The next step was to understand the data from the business side. This task was assigned to the product management team which collaborates closely with the station technical experts. The team of station experts should validate our findings to make a decision about our next steps: whether we continue the investigation or start building software with our findings in mind.
In case you’re interested in another case study on manufacturing, check this post on the problem of false defect detection and how we solved it.
Business outcomes
An effective predictive maintenance solution in manufacturing requires clear and properly labeled data for at least a few years. The ambiguous data for many of the parameters is not the best for building correct assumptions. It is quite common for companies to collect historical data, but to build an effective machine learning data analysis solution the collection process should be adjusted appropriately. Our partners had challenges similar to any company that steps on the path of introducing a solution like this.
We advised our partner to update a data-collection pipeline to get all necessary information from the OCPP communication protocol. You can learn more about the creation of a data collection pipeline for ML-powered anomaly detection solutions in this article. This is how the data pipeline might look:

Proper data warehouse architecture should also be implemented for better results. In our case, the data on a collection phase was transformed and saved in the aggregated state, but the raw OCPP data was never stored as it is, and this could be improved. Storing raw data is very important for an organization because this allows having all the information in its original state. With raw data, the organization will be able to transform data into different forms, perform deep analysis, generate reports, and merge with other data sources for getting more insights.
EV charger machining also plays a key role in ensuring the reliability and longevity of charging stations. By integrating advanced manufacturing techniques, such as precision machining for EV chargers, companies can improve the mechanical components of the charging stations, reducing wear and tear over time and increasing overall efficiency.
Data warehouse architecture suitable for ML projects might look like this:

Predictive maintenance data analysis is a critical task that needs to be solved before building a powerful ML-based solution. There are some common issues for organizations, which we talked about in the article, but ultimately knowing and understanding the data makes a business more resistant. EV charging company got data analysis and consultations from Intelliarts at the right moment to improve their data collection strategy.
Outcomes of the project so far:
- Now our partners have information that the raw data should be collected for at least one year or more in a proper format. They know exactly what type of information is needed for the desired solution and are going to increase the variety of sensors in their stations.
- The data labeling should be automated with manual input minimized, while the labels themselves should have only one meaning and more label categories should be added.
- The raw data should be stored separately from application storage. That storage could be used as a source of data for machine learning tasks.
At the moment our partner continues to collect data for the project, which is currently ongoing. The data analysis showed some aspects that could be improved to build an ML-powered predictive maintenance and anomaly detection solution faster and eventually gain a strategic advantage on a competitive EV chargers market.
Wrap up
Data analytics is revolutionizing the EV charging ecosystem, businesses to optimize EV charging locations performance and enhance reliability. From tracking key metrics to implementing predictive maintenance, data analytics for electric vehicles empowers businesses to stay competitive. As demonstrated in our real-world case study, data-driven EV charging optimization is key to improving operational efficiency, as well as helping to minimize downtime.
Looking ahead, the role of electric vehicles (EVs) and data analytics will only expand as the industry grows, driving further advancements in charging infrastructure.
We at Intelliarts love to help companies solve the challenges with big data strategy design and implementation, so if you have questions related to ML pipelines in particular or other areas of data science consulting or want to know more about our predictive maintenance analytics case study — feel free to reach out.

FAQ
1. What is the role of big data analytics in predictive maintenance?
Big data analytics largely complements predictive maintenance systems by enabling the analysis of large volumes of data from various sources, including sensors, machine logs, and other equipment-related data. Additionally, insights obtained with the help of big data analytics help optimize maintenance schedules, reduce downtime, and improve equipment performance. Big data and AI technologies work in tandem to enhance predictive analytics, leading to smarter and more efficient maintenance strategies.
2. What is predictive maintenance using AI and ML?
Predictive maintenance with AI and ML involves using algorithms to analyze large volumes of historical data and identify trends, patterns, and abnormalities in equipment performance. This way, innovative technologies make it possible to identify factors that impact equipment failure and minimize their disruptive impact.
3. What problems does predictive maintenance solve?
Among problems in manufacturing that predictive maintenance can help to resolve are frequent equipment failures and downtimes, high maintenance costs, inadequate equipment performance, and poor labor safety.