
TL;DR
- Custom agritech software runs from about $12,000 for a short technical assessment to $1,600,000 and above for an enterprise platform combining IoT, AI, and GIS.
- The bands price engineering at a blended $60 to $90 per hour, matching the $65.38 median hourly wage reported for US software developers as an example.
- Scope, data condition, integration count, and the depth of AI work decide where a project falls inside that range.
- A proof of concept, an MVP, and a production platform sit at different investment levels, each with its own agritech data pipeline cost.
- Discovery removes 15 to 25 percent of initially requested scope, according to ScienceSoft delivery data.
- All figures are indicative planning ranges. Intelliarts issues a project-specific estimate after discovery and a data review.
Agrifoodtech funding held flat through 2025 at $16.2 billion, while deal count fell 12%, according to the AgFunder Global AgriFoodTech Investment Report 2026. Upstream companies building for farm and food production took $9 billion of that total. With capital steady and rounds fewer, budgets receive closer scrutiny, and software estimates are examined line by line.
This article sets out indicative agritech data pipeline costs, from a technical assessment through to a production platform. It covers what a complete estimate includes, what drives agritech data pipeline cost and AI work, which expenses are commonly omitted, and how to select a pricing model.
How much does custom agritech software cost?
Custom agritech software costs range from about $12,000 for a short technical assessment to $1,600,000 and above for an enterprise platform with IoT, AI, and GIS, with agritech data pipeline cost sitting inside every band.
The bands below price engineering effort at a blended $60 to $90 per hour. The lower bound corresponds to the $65.38 median hourly wage US employers report for software developers. Scope, data condition, integration count, and the depth of AI work determine where a project falls within that range.
Those four inputs are easier to read against delivery formats, so the table groups the engagement types agritech teams usually budget for. Cost bands come from published 2026 vendor benchmarks and cover the build itself, with recurring platform fees listed separately.
| Project type | Typical scope | Indicative timeline | Indicative cost (USD) | Main cost driver |
|---|---|---|---|---|
| Discovery and technical assessment | Requirements, data audit, architecture, roadmap | 2–6 weeks | 10,000–30,000 | Number of legacy systems and data owners involved |
| AI or data proof of concept | One use case, limited data, technical validation | 4–10 weeks | 30,000–80,000 | Labeling volume and availability of historical records |
| Agritech MVP | Core application, data pipeline, selected integrations | 3–6 months | 70,000–200,000 | Integration count and offline field requirements |
| Production data platform | Multiple data sources, automation, monitoring, scalability | 6–12 months | 200,000–600,000 | Data volume, real-time processing, geospatial workloads |
| Enterprise agritech ecosystem | IoT, AI, GIS, mobile, web, integrations, MLOps | 9–18+ months | 600,000–1,500,000+ | Device protocols, multi-region models, compliance scope |
| Ongoing support and MLOps | Hosting, monitoring, drift detection, retraining, L3 support | Continuous | 3,000–16,000+ per month | Model count, data refresh frequency, SLA level |
Looking for a more accurate, project-tailored estimation?
We can provide an estimate that reflects your projects’ conditions and objectives.
Request a custom price quote
Because the ranges above assume a defined scope, every agriculture-specific requirement raises them. Sensor protocols, satellite imagery, and offline field use, for instance, require engineering that general business software omits. Seasonal data compounds those additions, since a yield or disease model often requires a full crop cycle before its accuracy can be confirmed.
From what we observed in industry cases, Intelliarts experts advise spending on discovery before locking in any figure. A structured discovery phase removes 15 to 25 percent of the initially requested scope without affecting business outcomes, according to ScienceSoft delivery data.
The next section will delve more into how different components of software architecture required for an industry solution to function impact the scope and pricing.
What is included in the cost of agritech software development?
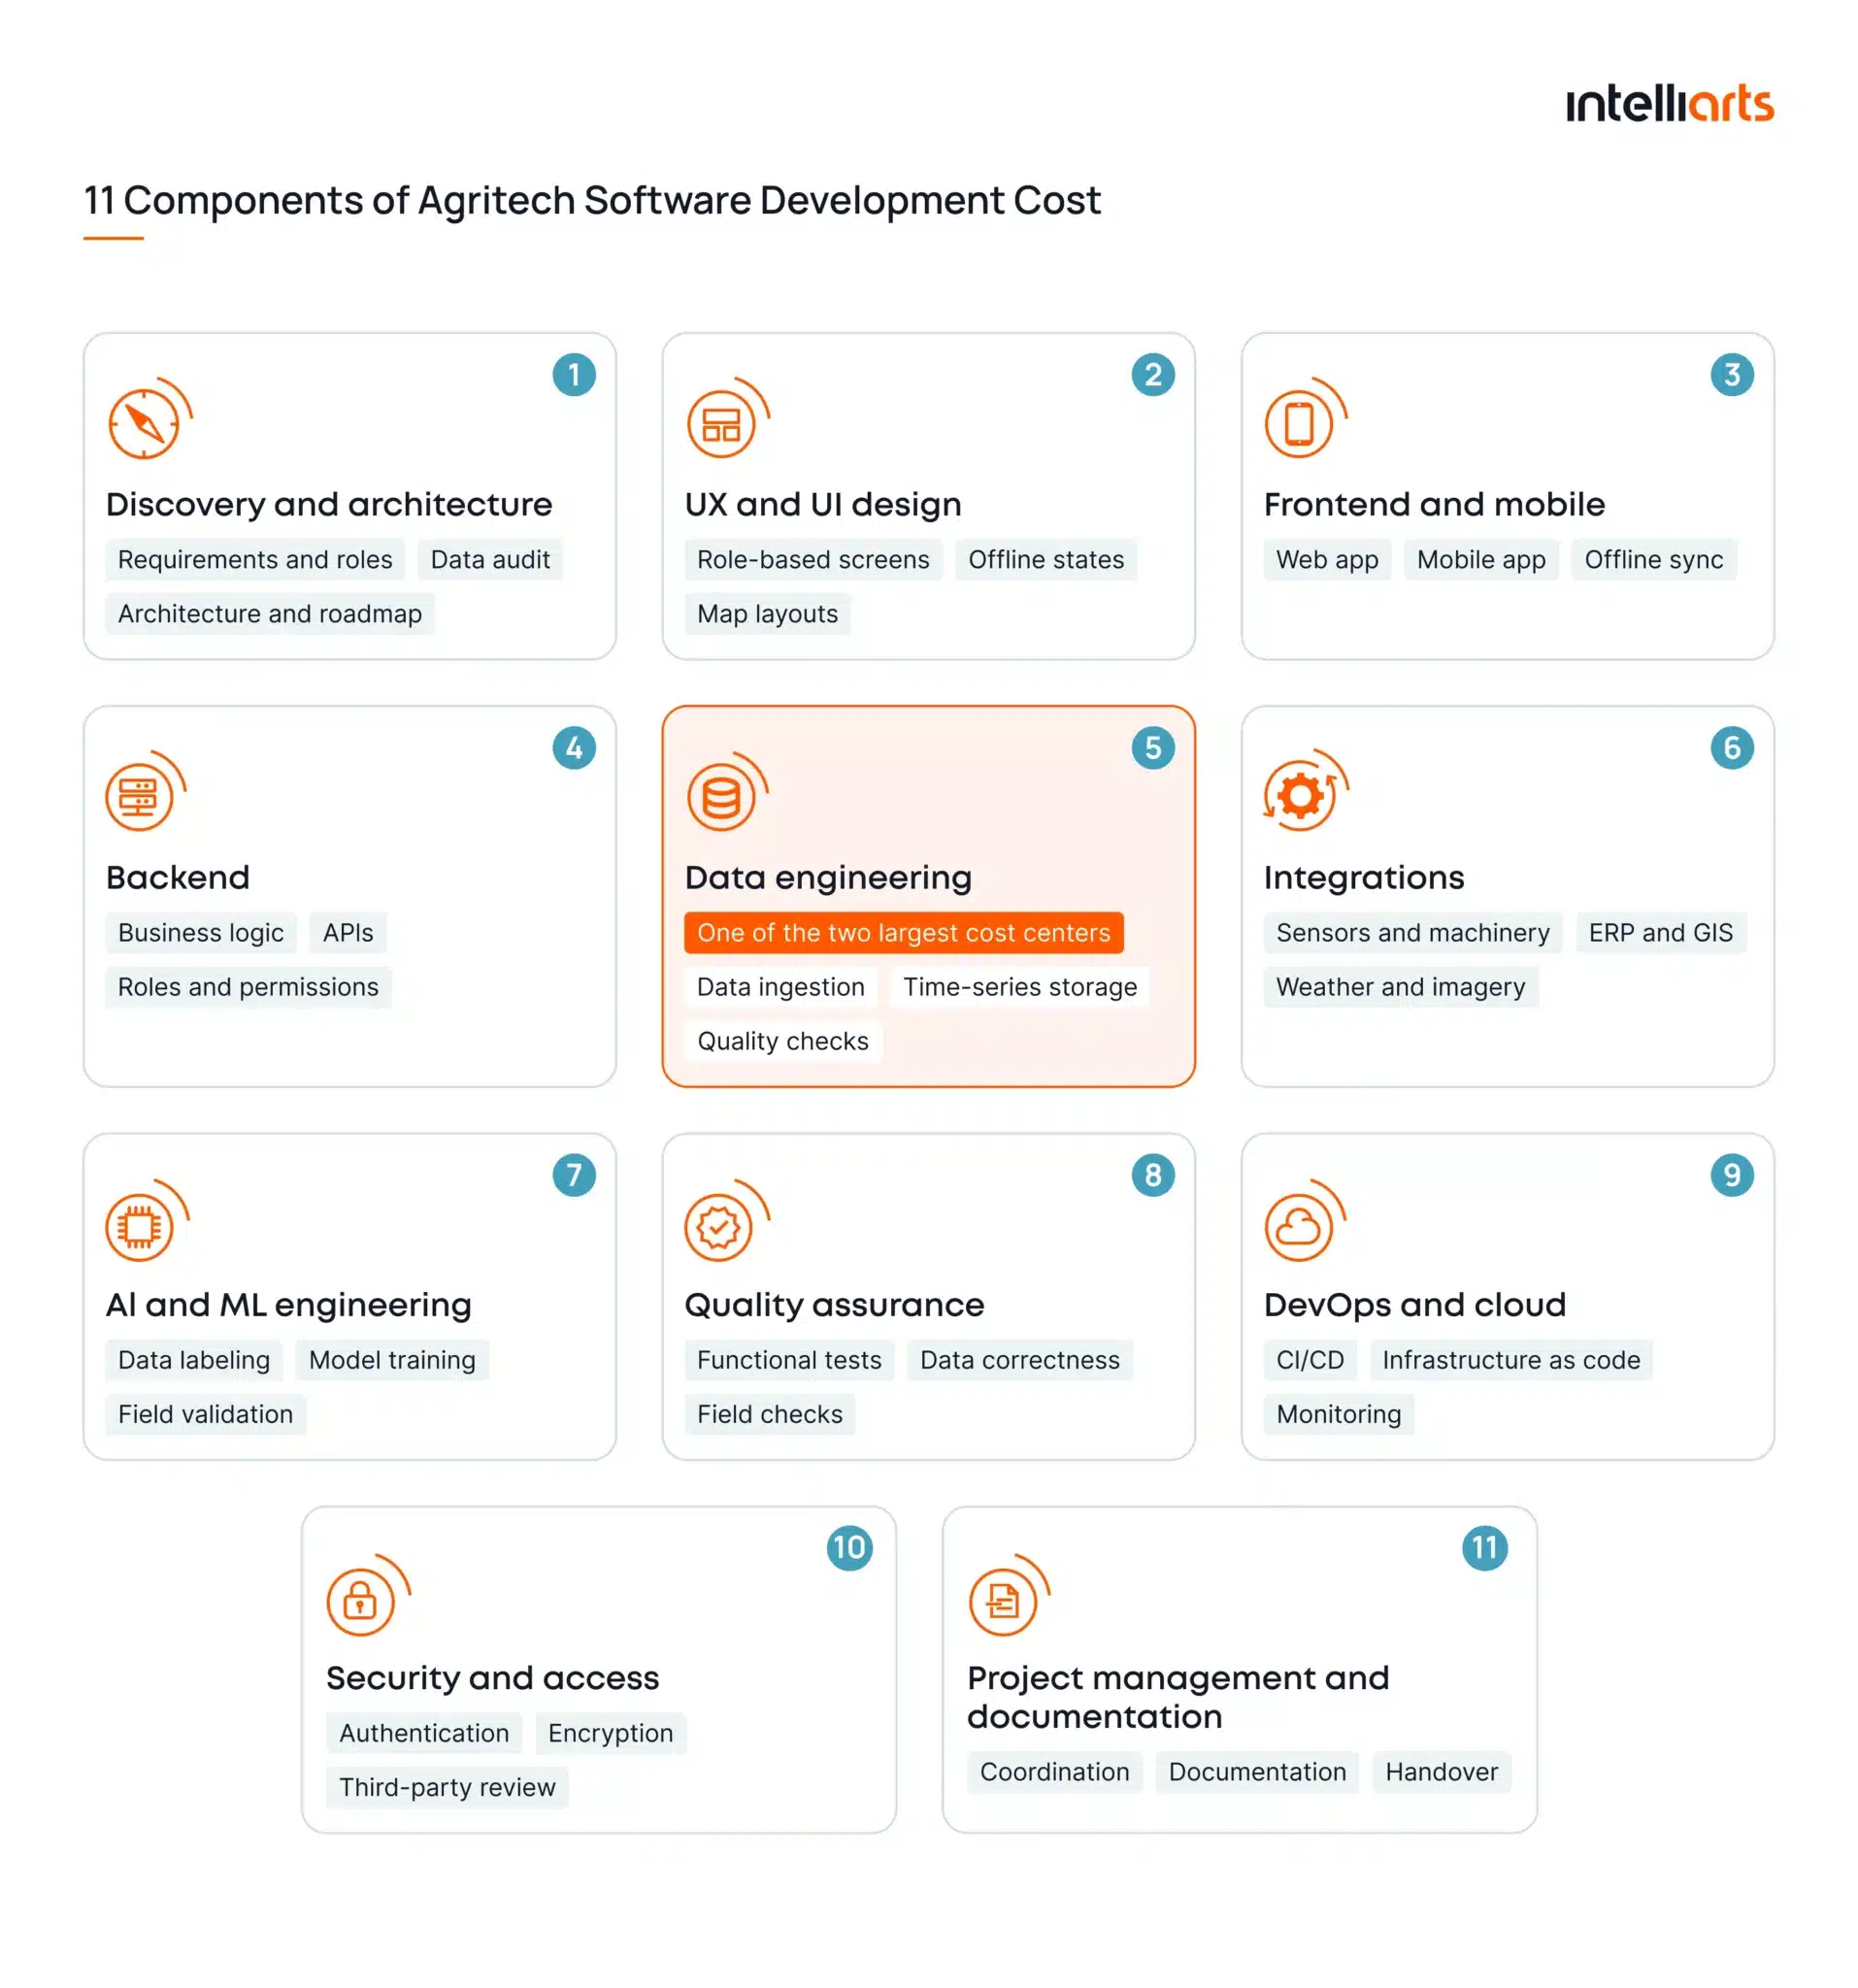
An agritech estimate covers eleven architecture and project components, from discovery through documentation. Each one carries its own hours, and agriculture-specific requirements raise the effort inside several of them, particularly data engineering, integrations, and QA.
Agritech software development cost therefore depends on which components a project actually needs, and agritech data pipeline cost accounts for the largest of them.
The breakdown below shows what a complete proposal itemizes. Each entry represents billable work, so any component missing from a quote will appear later as a change request.
- Discovery and architecture.
This phase converts a business goal into a technical plan, and it determines the accuracy of every later estimate. Its output covers:
- Requirements and user roles
- Data audit across existing systems
- System architecture and technology selection
- Delivery roadmap with phases
- UX and UI design.
Agritech interfaces are used outdoors, on tablets, and often with one hand, so design effort exceeds that of an office application. Field conditions require:
- Role-based screens for agronomists, operators, and managers
- Offline and low-signal states
- Map, dashboard, and reporting layouts
- Frontend and mobile development.
Development effort depends on how many clients the product supports and how they behave without connectivity. A web application alone costs less than a web and mobile pair with local caching and background sync.
- Backend development.
The backend holds business logic, user management, and the APIs that every other component consumes. Its cost grows with the number of user roles, permission rules, and reporting scenarios the platform serves.
- Data engineering.
This work moves field data into a usable form, and it forms one of the two largest cost centers in agritech projects. It includes:
- Ingestion from sensors, machinery, and external services
- Storage design for time-series and geospatial data
- Transformation, cleaning, and quality checks
- Integrations.
Each IoT integration requires its own mapping, authentication, and error handling, so connection count affects the total directly. Typical connections cover:
- Sensors and machinery telemetry
- Weather and satellite imagery services
- ERP, accounting, and GIS platforms
- AI and ML engineering.
Model work begins long before training, since agricultural datasets usually need preparation first. The line item spans:
- Data preparation and labeling
- Feature engineering and model training
- Validation against field results
- Deployment into production
- Quality assurance.
Testing verifies both software behavior and data correctness, which distinguishes agritech QA from standard application testing. Beyond functional and performance testing, teams verify readings against physical conditions in the field.
- DevOps and cloud setup.
This component prepares the cloud infrastructure the product runs on, together with the automation that keeps releases predictable. It covers environment configuration, CI/CD pipelines, infrastructure as code, and monitoring setup.
- Security and access control.
Access rules protect farm-level data that clients treat as commercially sensitive. Effort concentrates on:
- Authentication and permission models
- Data protection in transit and at rest
- Third-party risk review for connected services
- Project management and documentation
Coordination time scales with team size and the number of stakeholders involved on the client side. Documentation and handover materials belong in the same line, since they determine how easily another team can maintain the system later.
It’s worth knowing that data acquisition itself for building custom agritech software might be cheaper than expected. For example, the European Union grants free, full, and open access to Copernicus Sentinel satellite data, so imagery adds no licensing fee for many use cases.
Processing that imagery is the paid part, since geospatial pipelines require storage, cloud compute, and validation against field observations. As per the Garbage-in-Garbage-out (GIGO) rule, a failure to process data properly before feeding it into, for example, computer vision AI for agritech, can lead to unsatisfactory development outcomes.
Take a look at our corresponding blog post on how Intelliarts implemented computer vision technology to explore business uses of AI software.
Agritech software cost by project scenario
Cost ranges and component lists describe agriculture software cost in the abstract, while real projects arrive as a named product with a defined purpose. A smart irrigation platform and a yield forecasting solution may carry similar price tags, yet their risks differ completely. Because those risks decide whether an estimate holds, scenario matters as much as scope.
The table gives an indicative build effort behind development of software for each scenario, and mentions typical components that consume the largest share of hours. Figures follow the same $60 to $90 hourly basis used earlier in this article.
Keep in mind that end rates for your project may drastically differ. For example, net development cost per hour may be notably less than $90. However, other one-time or recurring expenses will still push pricing higher, resulting in somewhere around the specified cost if calculated using an hourly basis only.
| Scenario | Typical components | Indicative build cost and effort | Main cost risks | Time to first result |
|---|---|---|---|---|
| Smart irrigation platform | Sensors, weather data, rules or ML logic, scheduling, dashboard | 1,400–2,800 hours · device integration takes 30–40% | Hardware integration, missing readings, field connectivity | 2–4 weeks after sensor deployment, then one irrigation cycle for measurable savings |
| Yield forecasting solution | Historical yield, weather and soil data, ML pipeline, reporting | 1,800–3,400 hours · data preparation takes 40–50% | Data quality, regional variation, seasonal validation | One harvest, because accuracy requires actual yields |
| Crop-monitoring platform | Satellite or drone imagery, GIS layers, alerting, mobile access | 3,000–6,000 hours · geospatial processing takes 35–45% | Processing volume, compute cost, ground-truth validation | 4–8 weeks, since alerts work from the first imagery cycle |
| Farm management system | Web and mobile apps, records, reporting, ERP integrations | 2,800–6,500 hours · application work and integrations take 50–60% | Feature scope, migration, offline workflows | 3–6 months, once the first department adopts it |
| Equipment-monitoring system | Telemetry ingestion, streaming, alerting, predictive maintenance | 3,200–7,000 hours · protocol and streaming work takes 35–45% | Device protocols, telemetry volume, edge processing | 4–6 weeks for alerts, one season for maintenance accuracy |
| Agricultural data platform | Multiple sources, pipelines, warehouse, governance, analytics | 6,000–14,000 hours · data engineering takes 55–65% | Scale, governance, normalization across formats | 4–6 months, since downstream teams need the warehouse first |
- Note: Indicative planning figures for a single-region deployment. Multi-region rollouts and mixed equipment fleets raise both ends of each range. Additionally, as you can conclude, risks to account for largely depend on your business scenario.
For imagery-based products, Intelliarts covered the processing and validation requirements in a separate review of satellite remote sensing in precision agriculture.
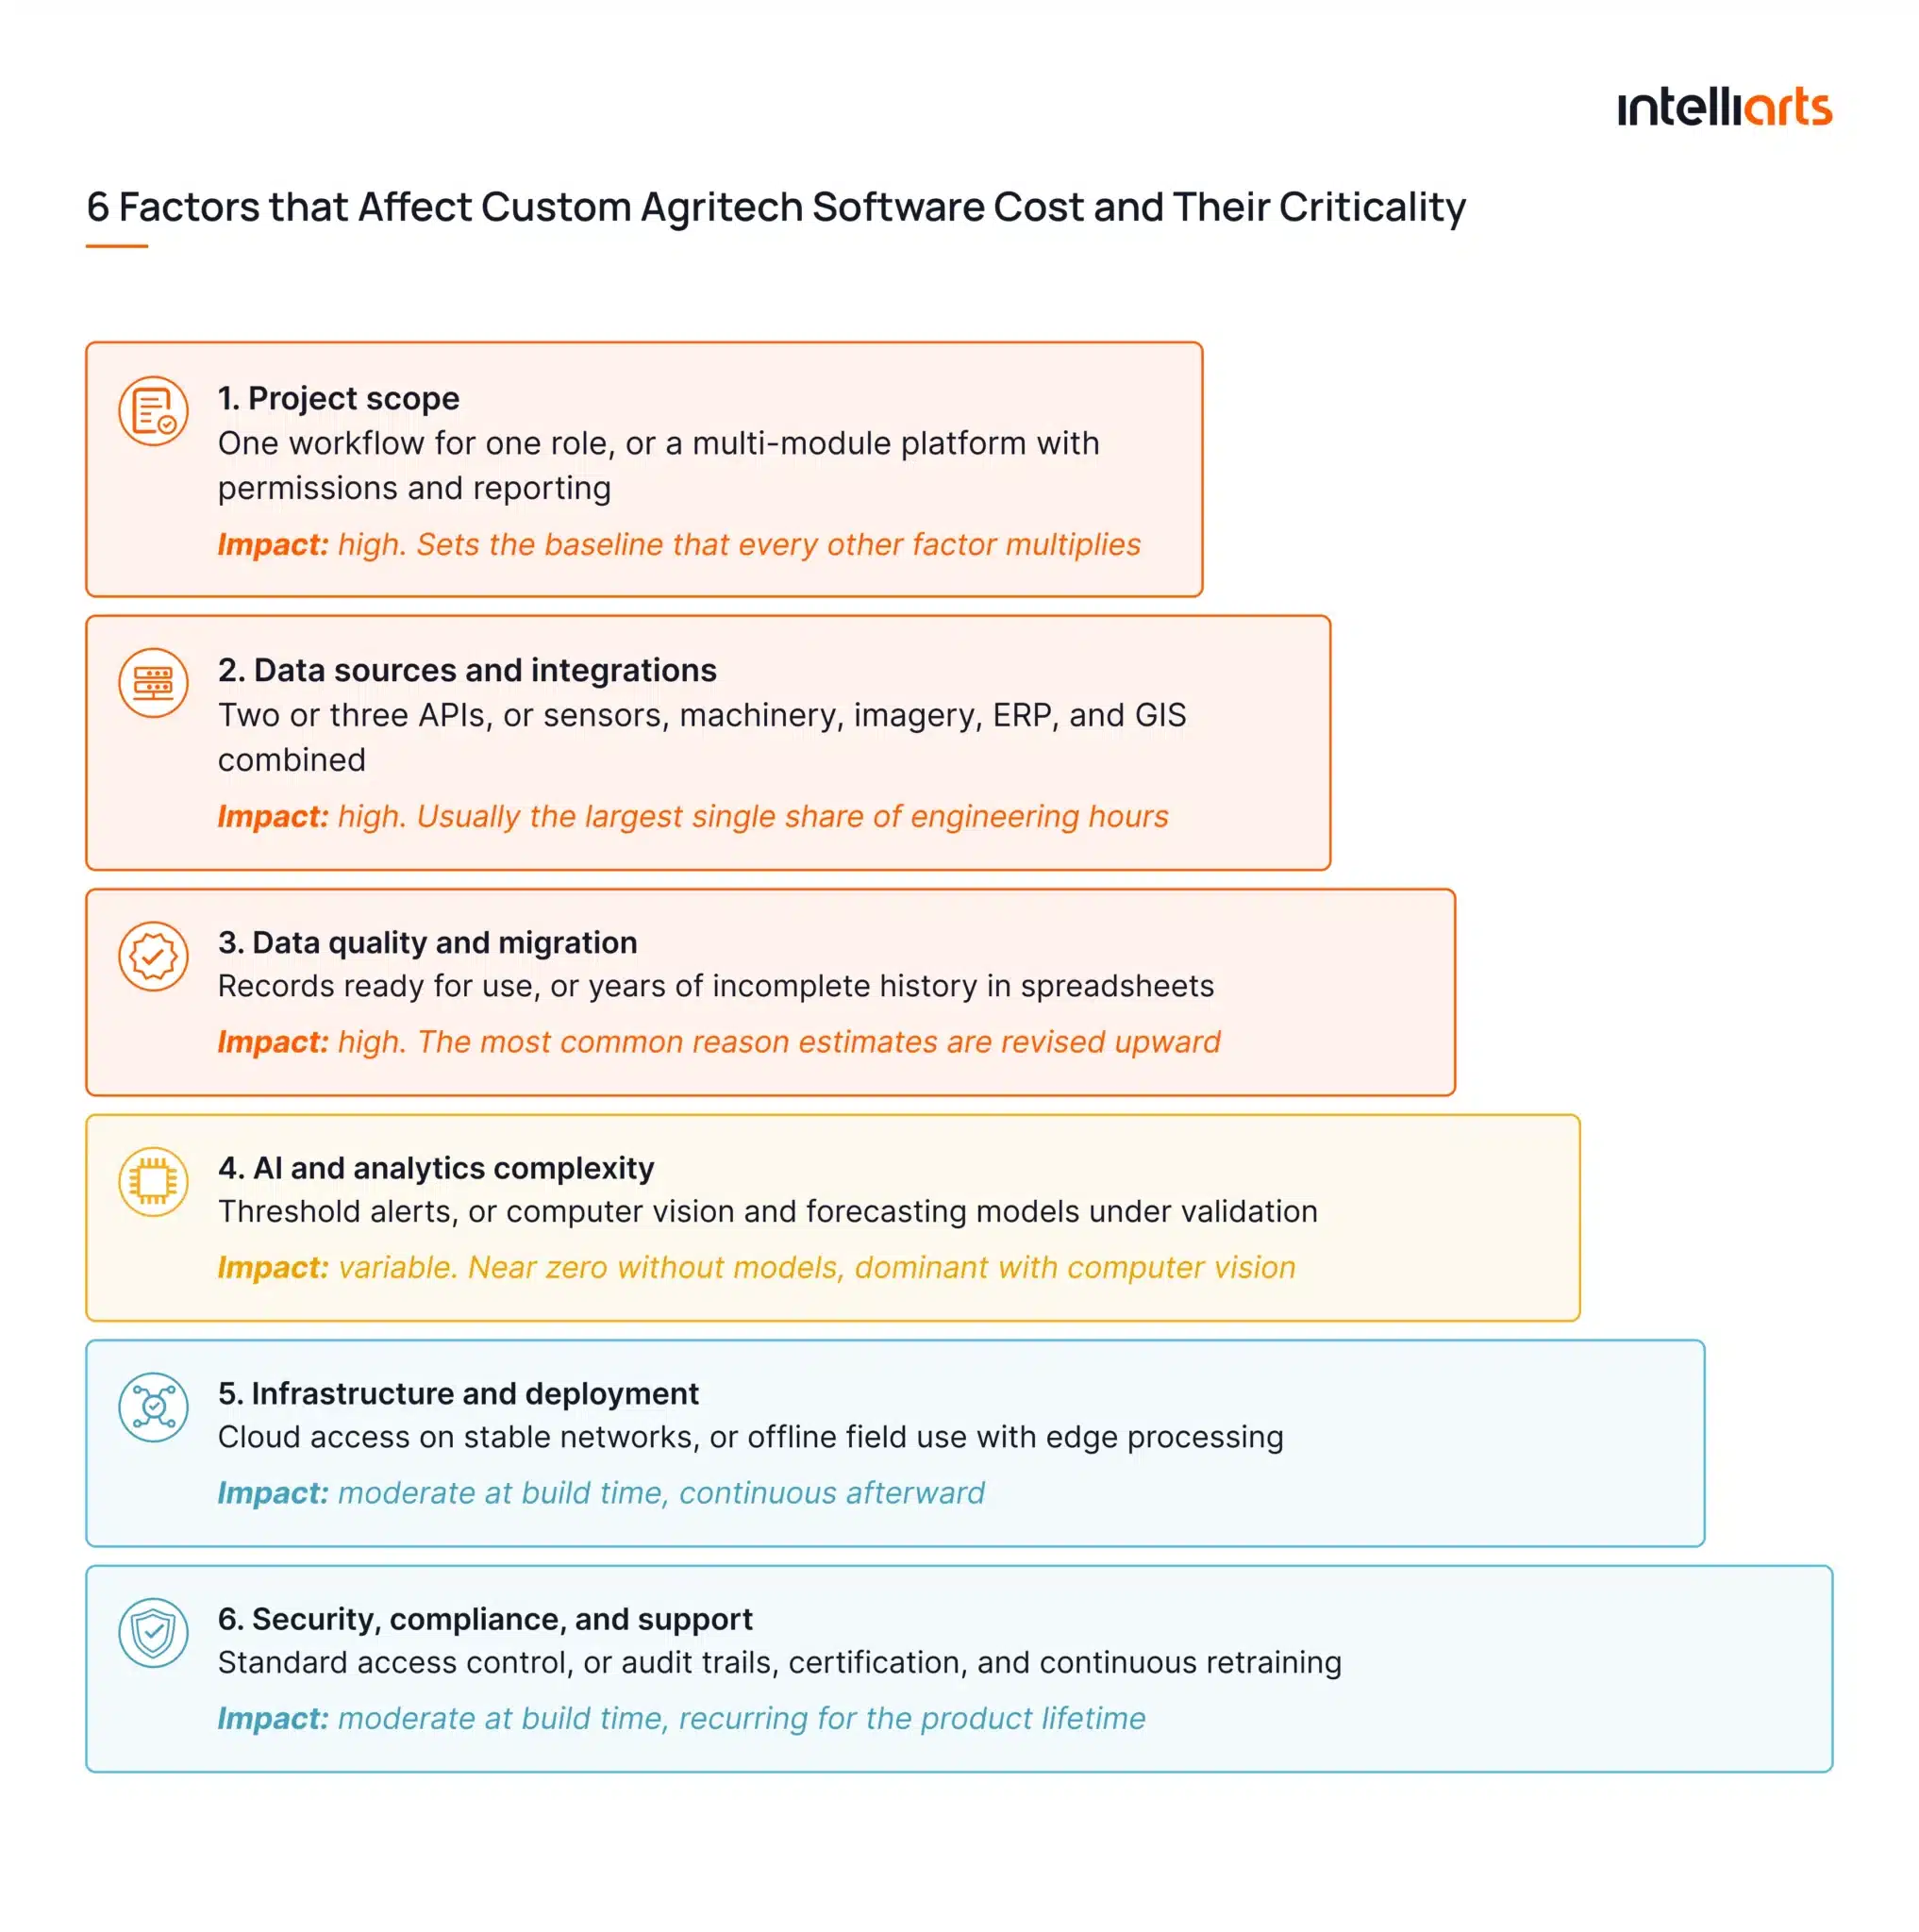
Six main factors that affect agritech software cost
Six factors account for most of the difference between a small agritech tool and a production platform. Because they compound, similar feature lists can produce estimates that differ several times.
Project scope and number of features
- Low impact scenario: One workflow, one user role
- High impact scenario: Multi-module platform, several roles, admin and reporting
Cost impact: ×1 to ×4 on the baseline
Scope defines the baseline that other factors multiply. A single-workflow tool costs less than a platform for several roles, since each added module requires separate testing and documentation.
Check first: The number of user roles and modules approved for the first release
Data sources and integrations
- Low impact scenario: Two or three stable APIs
- High impact scenario: Sensors, machinery, imagery, ERP, and GIS in one system
Cost impact: +15% to +40%
Each connected system requires mapping, authentication, and error handling, so the number of sources predicts effort better than data volume. Agritech projects usually connect several of the following:
- IoT sensors in fields and storage facilities
- Farm machinery telemetry
- Weather services
- Satellite and drone imagery
- ERP systems
- GIS platforms
- Existing farm databases and spreadsheets
Two-way integrations cost more than read-only connections, since writing into an ERP requires validation and rollback handling, and each additional source raises agritech data pipeline cost before interface work begins.
Check first: The list of systems in scope, and whether each connection is read-only or bidirectional
Data quality and migration
- Low impact scenario: Structured records, consistent naming, recent history
- High impact scenario: Spreadsheets, missing seasons, three legacy databases
Cost impact: +10% to +30%
Legacy records usually require correction before analysis, because of missing values, inconsistent naming, and unrecorded seasons.
This factor also presents the highest estimated risk, since its scale becomes visible only after a data audit, and correction of legacy records is billed inside the agritech data pipeline cost.
Check first: The date of the last data audit and the completeness of historical records
AI and analytics complexity
- Low impact scenario: Threshold alerts and rule-based logic
- High impact scenario: Computer vision on imagery, validated against field results
Cost impact: 0% to +50%
Analytics effort grows with the type of question a product answers. Rule-based logic remains inexpensive, whereas a custom AI model raises data, compute, and validation requirements, and every accuracy target adds labeling work. The order below runs from lower to higher cost:
- Rule-based alerts and threshold monitoring
- Descriptive reporting and anomaly detection
- Forecasting for yield, demand, or irrigation timing
- Recommendation and optimization engines
- Computer vision on drone or satellite imagery
Check first: Whether the target decision requires a model, or existing business rules already cover it
Infrastructure and deployment environment
- Low impact scenario: Cloud access, stable connectivity, batch updates
- High impact scenario: Offline field operation, edge processing, continuous telemetry
Cost impact: +10% to +25%
Field connectivity is limited, so precision agriculture software cost includes deployment work that office software omits, and edge processing raises agritech data pipeline cost against a cloud-only baseline.
A cloud-only product remains cheaper, whereas offline operation, edge processing, and continuous telemetry each add architecture, storage, and testing work.
Check first: The service level the product must hold in areas without stable connectivity
Security, compliance, and support
- Low impact scenario: Role-based access, standard hosting
- High impact scenario: Audit trails, certification programs, retraining commitments
Cost impact: +5% to +20% at build, then recurring
Client and regulatory requirements apply throughout the product lifetime. Access management, encryption, and audit trails increase build effort, while monitoring and model retraining continue as recurring cost.
Check first: The certifications and audit obligations named in your client contracts
The infographic below provides a visual overview of these six variables that can affect end pricing and indicates their general criticality:
What costs are often missing from the initial estimate?
As mentioned earlier, oftentimes some supporting measures and less noticeable project needs get overlooked during initial scoping and pricing.
Based on what Intelliarts observed in our many projects, including those in the agritech sector, here are expenses that businesses shouldn’t forget to account for and their approximate amounts:
These items divide into two groups. One-time costs appear during the build and are usually absorbed into the project budget once identified. Recurring costs continue for as long as the product operates, and recurring agritech data pipeline cost is the item omitted most often over a three-year horizon.
The one-time items below are the ones most often absent from a first estimate.
| Cost item | Approximate amount (USD) | Budget stage |
|---|---|---|
| Discovery and data audit | 10,000–30,000 | Before development starts |
| Data cleaning and preparation | 10–20% of the build budget | First weeks of data engineering |
| Data labeling for AI models | 5,000–40,000 | Before model training |
| Commercial imagery for high-resolution needs | 2,000–25,000 per season | During model development |
| Device and hardware provisioning | 50–300 per sensor node | Pilot and rollout stages |
| Security review and penetration testing | 5,000–15,000 | Before production release |
| User training and rollout support | 3,000–10,000 | Launch period |
| Data migration from legacy systems | 8,000–35,000 | Parallel to development |
Recurring costs follow different logic, since they scale with usage rather than scope. A platform that serves ten farms and one that serves two hundred require the same code, yet their monthly figures differ substantially.
| Cost item | Approximate amount (USD) | Budget stage |
|---|---|---|
| Cloud infrastructure | 500–5,000 per month | Storage and compute grow with telemetry volume |
| Third-party API fees | 200–3,000 per month | Weather, mapping, and commercial data services |
| Vendor licensing | 100–2,000 per month | GIS, BI, and specialized processing tools |
| Post-launch support and bug fixing | 15–20% of the build budget per year | Covers defects, updates, and minor changes |
| Model monitoring and retraining | 1,500–6,000 per month | Scales with model count and data refresh rate |
| Integration maintenance | 1,000–3,000 per month | Third-party APIs change without notice |
Total cost of ownership (TCO) adds everything required to keep it accurate and available afterward. For a typical agritech platform, first-year ownership adds 25 to 40 percent on top of the build. That share grows once several models run in production.
Complete TCO framework for LLMs in a single white paper
Learn about AI governance and maintenance costs for agritech products.
Get your copy
Fixed price vs. time and materials for agritech projects
Fixed price works when the deliverable is defined and stable, while time and materials works when data, integrations, or model feasibility may change during development.
Agritech projects usually involve both types of pricing, and where agritech data pipeline cost cannot be fixed in advance, time and materials applies. That’s why most custom agritech software pricing agreements combine the two models across phases.
“Fixed price model is oftentimes a risk for both a customer and a vendor. It works either for well-defined scopes or smaller-scale projects as well as PoC/MVP/prototypes. A hybrid approach is usually the way to go.” — Alexander Barinov, Managing Partner at Intelliarts
See the difference between fixed price and time and materials, including agritech data pipeline cost, for a custom agritech project in the infographics below:
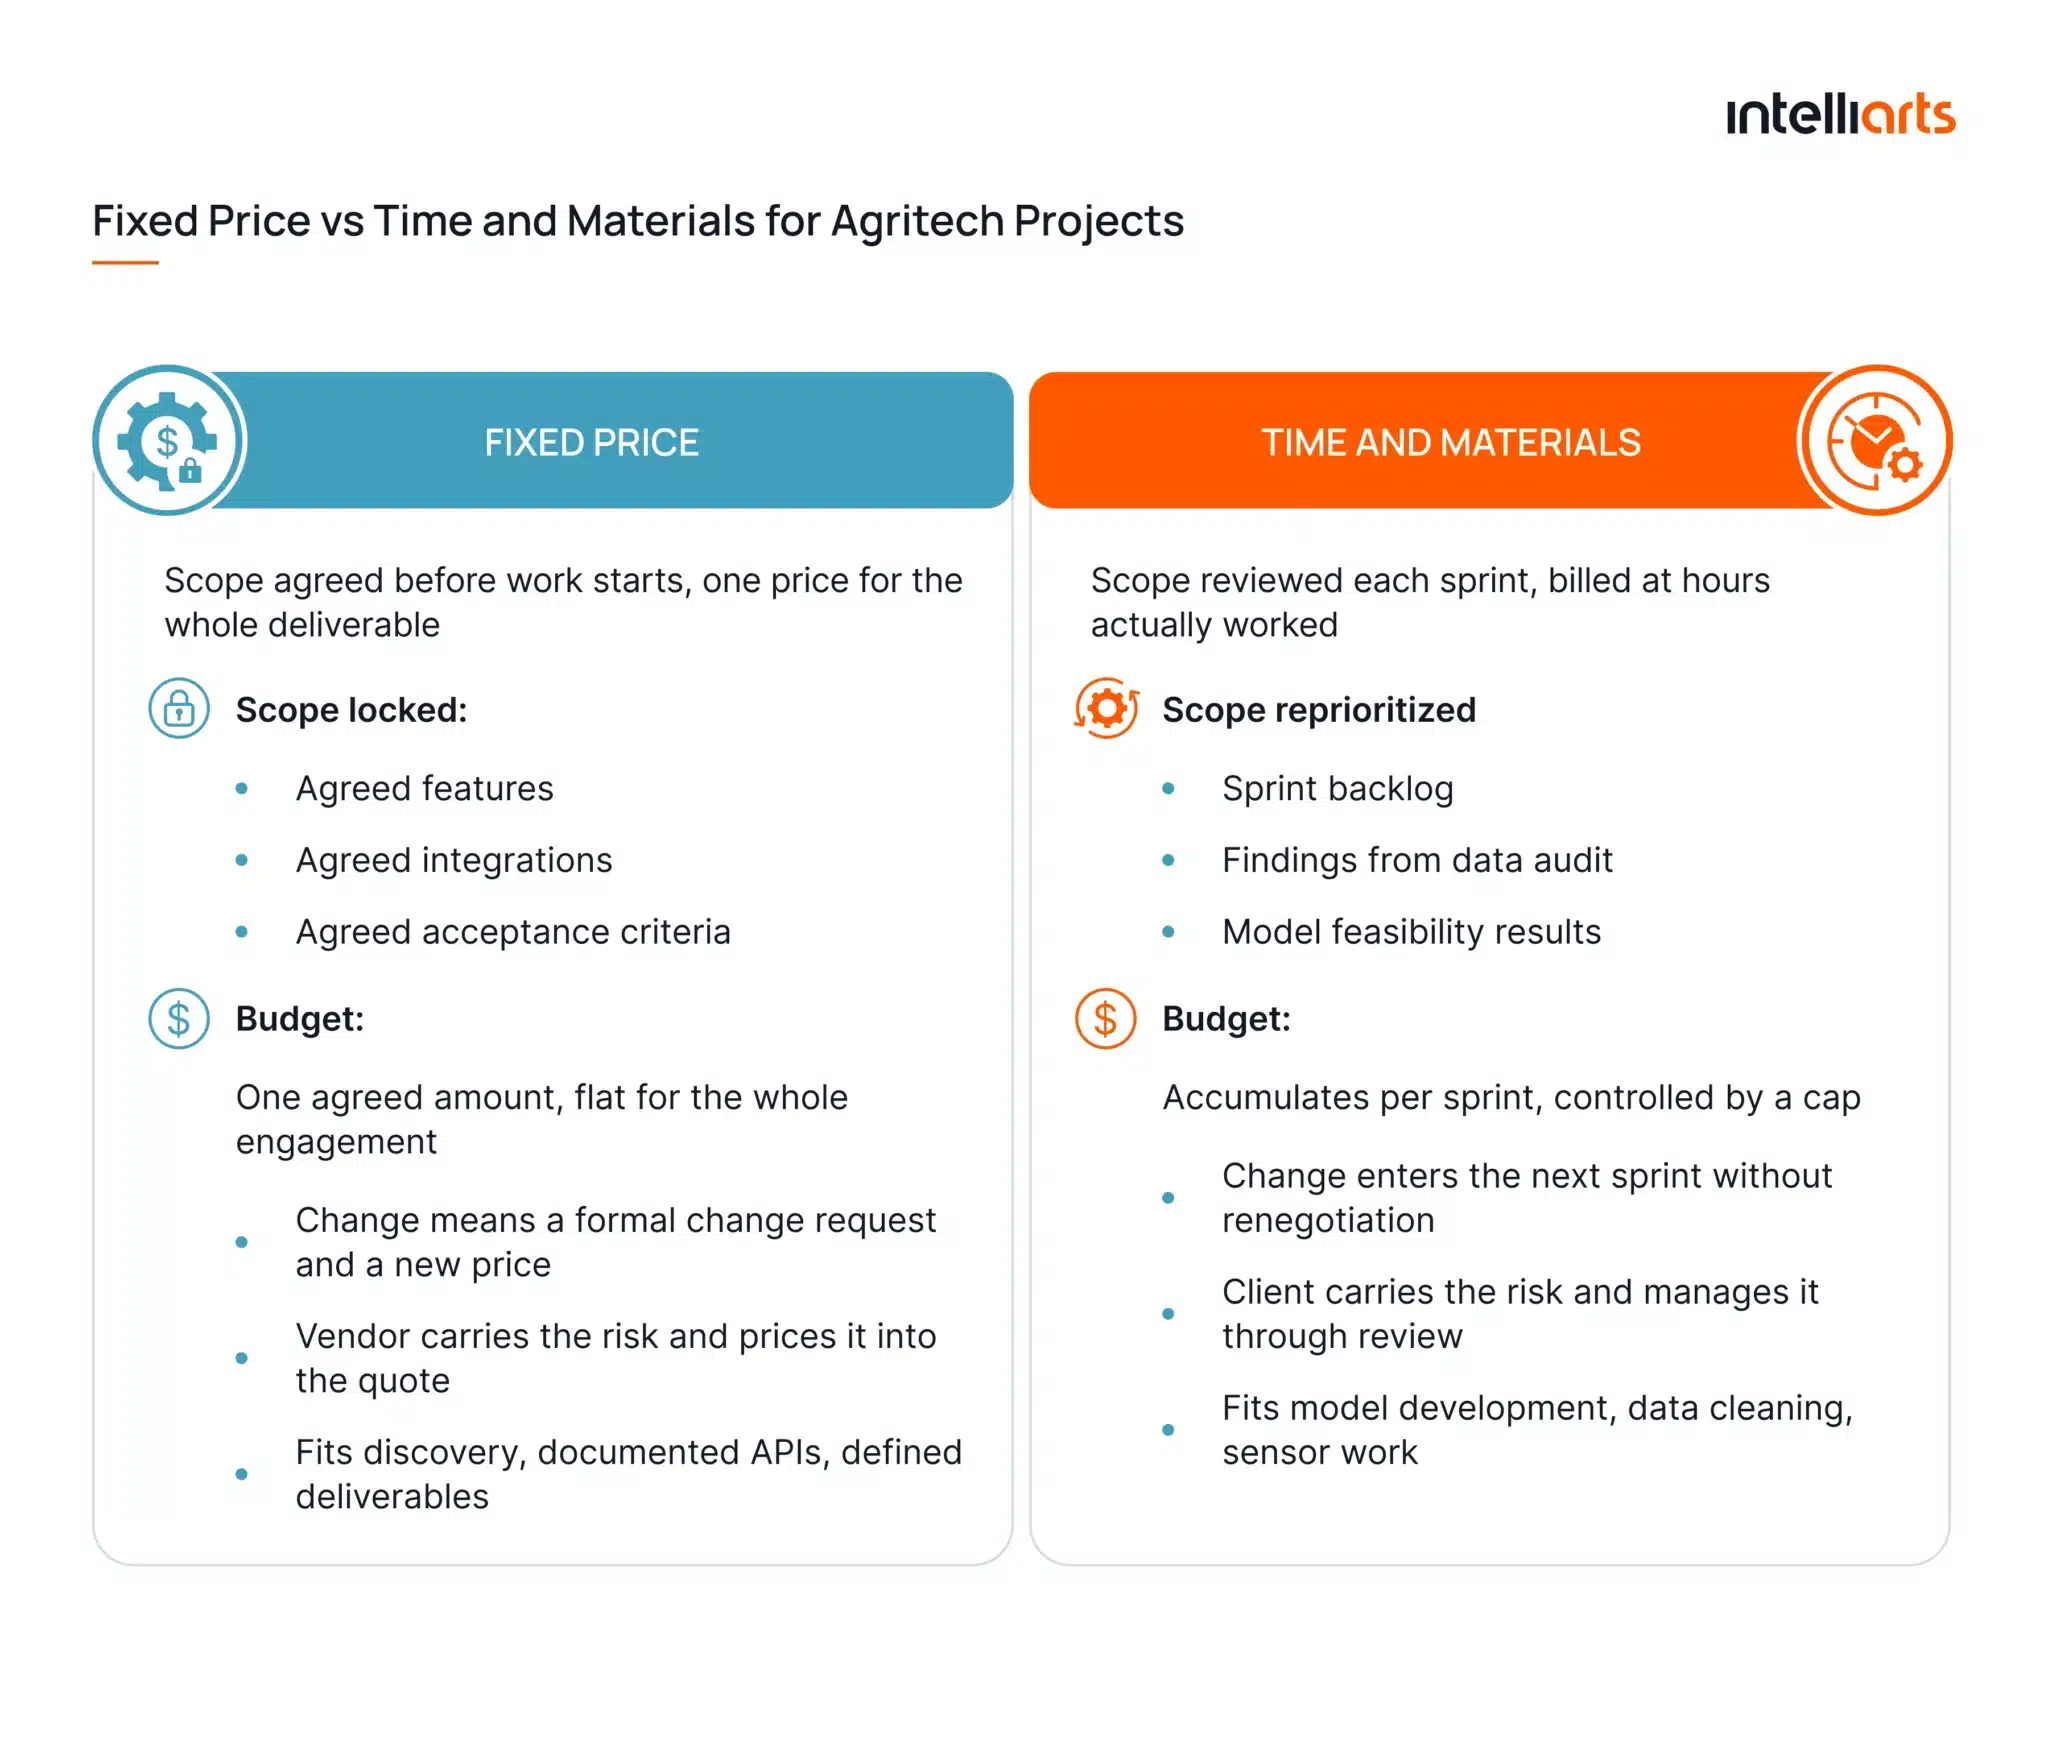
Procurement guidance frames this choice around scope certainty, and neither model is cheaper by default. A fixed price includes a risk premium the vendor adds for unknowns, whereas time and materials moves that risk to your side of the contract.
The table below matches common project work scopes to the model that fits each one:
| Project scenario | Optimal pricing model to use |
|---|---|
| Discovery and technical assessment | Fixed price or capped budget |
| Proof of concept on existing, reviewed data | Fixed price |
| Proof of concept on unreviewed historical records | Time and materials |
| Agritech MVP with a signed-off specification | Fixed price per release |
| Agritech MVP where data quality is still unknown | Time and materials, with a monthly cap |
| Integrations with documented public APIs | Fixed price |
| Integrations with machinery telemetry | Time and materials |
| Custom model development for new crops or regions | Time and materials, with a monthly cap |
| Production platform built in phases | Time and materials, with a cap per phase |
| Support, monitoring, and MLOps after launch | Monthly agreement |
A phased contract, also known as a hybrid contract, usually works better than one model applied to everything. Here’s how to make it work:
- Fixed or capped discovery phase. Discovery has a defined output, so its price can be fixed before any commitment to the full build. It delivers requirements, a data audit, and architecture.
- Estimated MVP budget. The MVP is priced after discovery, when scope and data conditions are known. An agreed scope boundary defines what counts as a change.
- Time-and-materials product development. Development after the MVP depends on user feedback and model results, so hours are billed as worked. A monthly cap keeps spending predictable.
- Monthly support or MLOps agreement. Once the system runs in production, support becomes a recurring service. It covers monitoring, retraining, and integration maintenance.
This structure protects both sides. Your team commits money in stages tied to evidence, while the vendor avoids pricing risk into work nobody can scope yet.
You may explore how the Intelliarts team approaches fixed, time and materials, and hybrid pricing types and how we usually get started with new projects on our RAG development services page.
How much does it cost to build a custom agritech data pipeline?
No single figure applies, since agritech data pipeline cost is set by eleven variables that differ on every project. A vendor can price the work reliably only after auditing the sources, their formats, and their update frequency. Estimates issued before that audit are revised during integration.
A data pipeline is the set of components that move records from their origin to the systems that consume them. We refer to its main stages as the following: data collection, storage, processing, and delivery. Altogether, this covers ingestion, validation, transformation into a common model, and access for applications and models.
Learn more about pipelines and how Intelliarts built a big data pipeline for our customer in another one of our blog posts.
Where the pipeline is absent, reconciliation is maintained in spreadsheets, and analytics is rebuilt whenever a source changes. From our delivery experience, this is where the largest share of unplanned agritech software development cost accumulates, because every downstream feature depends on inputs that no component owns.
The eleven variables specified below determine the build cost and the operating expenses that follow it:
- Number and type of data sources. Each source requires its own adapter, credential management, and failure handling, so engineering effort scales close to linearly with the number of connected systems.
- Data volume and frequency. Per-minute readings across thousands of devices require a different storage engine and compute profile from daily summaries.
- Batch or real-time processing. Batch runs on scheduled jobs, while streaming adds brokers, delivery guarantees, and on-call coverage, which raises both build and operating cost.
- Sensor and API integrations. Documented REST APIs connect quickly, while proprietary binary formats and legacy gateways require protocol work and coordination with the equipment vendor.
- Satellite or drone imagery. Cost moves into object storage, tiling, and per-scene processing, and any reprocessing of the archive multiplies that figure.
- Geospatial processing. Reprojection, cloud masking, and index computation run on every pass, so compute follows acreage and revisit frequency.
- Data cleaning and normalization. Unit conversion, identifier crosswalks, and timestamp alignment are written per source, and each schema change requires retesting.
- Storage requirements. Retention policy sets the bill, since raw payloads kept for reprocessing and audit multiply the volume held against transformed data alone.
- Quality-control rules. Each rule needs a definition agreed with agronomy, an automated test, and a remediation path for records that fail it.
- Security and access controls. Per-tenant isolation, role-based access, and audit logging add engineering work and recurring infrastructure cost.
- Monitoring and observability. Freshness checks, lag alerts, and error budgets are built once and paid for continuously, through infrastructure and staff time.
These cost factors indicate why two pipelines built for the same purpose can differ substantially in price.
“Late, duplicate, and out-of-order records are somewhat normal in agriculture, especially in earlier adoption stages. So prioritizing ingestion and timely retraining is crucial. Still, over a couple of seasons, the custom data pipeline should start receiving optimized, real-life data for the project to offer expected ROI eventually” — Oleksandr Stefanovskyi, strategic technology partner at Intelliarts
The data pipeline case study below shows the scope of agricultural data pipeline development using the example of integrating third-party agronomic sources:
Intelliarts success story: Data pipeline and automated data entry for Indigo Ag
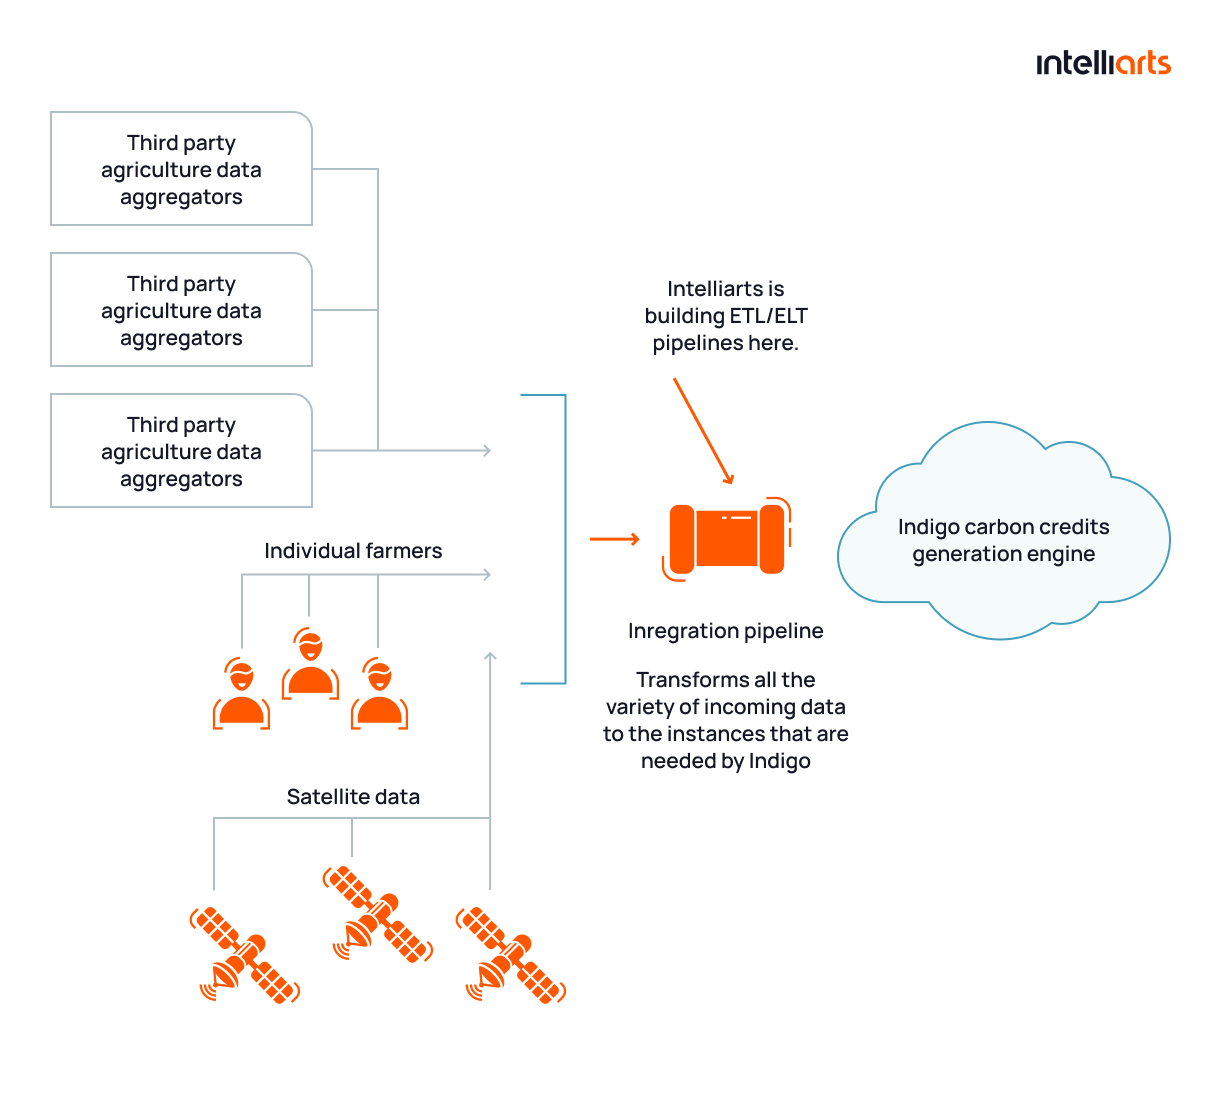
- Challenge: Growers spent up to eight hours entering historical field data manually, which slowed onboarding and reduced participation in the carbon program.
- Solution: Intelliarts built ETL and ELT pipelines with integrations to third-party agronomic data providers, layering ingestion through a medallion architecture with FSM logic so external data arrived in near real time.
- Results: Data entry time fell from hours to minutes, accuracy improved across systems, and user retention rose alongside it.
What drives the price of a custom AI model for agriculture?
AI development cost for agriculture is driven by three conditions: the state of the data, the class of model required, and what the system has to do in production.
Data preparation carries the widest variance within agritech software development cost, so a quotation issued before a data review reflects assumptions rather than scope.
Agricultural models are constrained by how their labels are produced. Agronomic ground truth comes from soil sampling, scouting, and harvest measurement, each limited by field access and cost.
Because those operations follow the season, a model deployed in June is validated only after harvest. Neighbouring observations also correlate, so blocked validation is required, which reduces the effective sample size a dataset provides.
Satellite time series extend coverage between field visits, an approach Intelliarts sets out in our work on satellite data and predictive analytics.
The following six cost factors appear in most estimates:
- Historical data availability, quality, and labeling. Several complete seasons reduce preparation to validation, while sparse archives require collection, and labels produced by agronomists carry a cost per record.
- Model class and data modality. Tabular records train quickly, while computer vision and geospatial work add annotation, tiling, reprojection, and index computation to every experiment.
- Accuracy target and operating coverage. Each increment above the baseline consumes additional iterations, and every extra crop, region, or condition needs its own validation set.
- Explainability and human review. Carbon programs and regulated reporting require documented reasoning, and exception handling adds agronomist time after release.
- Infrastructure and compute. GPU training, storage, and inference capacity form a recurring budget line that scales with acreage and revisit frequency.
- Integration, monitoring, and retraining. Output has to reach the farm management system or the machinery, and both monitoring and retraining are operated for the life of the system.
Data readiness
Data readiness describes the work required before training begins. Where three to five seasons of records are present in one system, preparation is limited to validation and format alignment.
Where they are spread across spreadsheets, machine exports, and paper forms, the dataset is assembled first, through collection, cleaning, matching, labeling, normalization, and enrichment.
USDA NASS reported in August 2025 that 68% of US farms had a desktop or laptop computer, which sets a ceiling on how much of the historical record exists in digital form at all.
Laboratory analysis is charged per sample, so a validation set of several hundred samples represents a five-figure commitment before training starts. Satellite inputs follow the opposite pattern, since Copernicus provides free and open access to Sentinel imagery, and expenditure shifts to processing, storage, and reconciliation with field records.
Model complexity
The model class determines the experimentation cycle, the infrastructure, and the maintenance profile, and it is the largest single lever on agriculture software cost.
| Model class | What it requires | Cost profile |
|---|---|---|
| Rules-based automation | Thresholds agreed with agronomy, no training data | Lowest to build, maintenance rises as rules multiply |
| Standard forecasting | Historical series, weather and agronomic records | Moderate, driven by data preparation |
| Classification | Labelled examples for each class | Moderate, rises with label volume and class count |
| Recommendation systems | Interaction history and feedback loops | Higher, requires continuous evaluation |
| Computer vision | Annotated imagery and GPU training | High, annotation dominates the budget |
| Remote-sensing models | Multi-temporal imagery, reprojection, cloud masking | High, with recurring compute per scene |
| Custom deep-learning models | Research iterations and large datasets | Highest, and reliable only after a proof of concept |
Production requirements
Training produces a model, while production requires the infrastructure that keeps it running. Nine components fall outside the training budget and remain in the operating cost for the life of the model, which is where estimates most often prove incomplete.
The infographic below groups them by function, so each one can be checked against a vendor proposal.
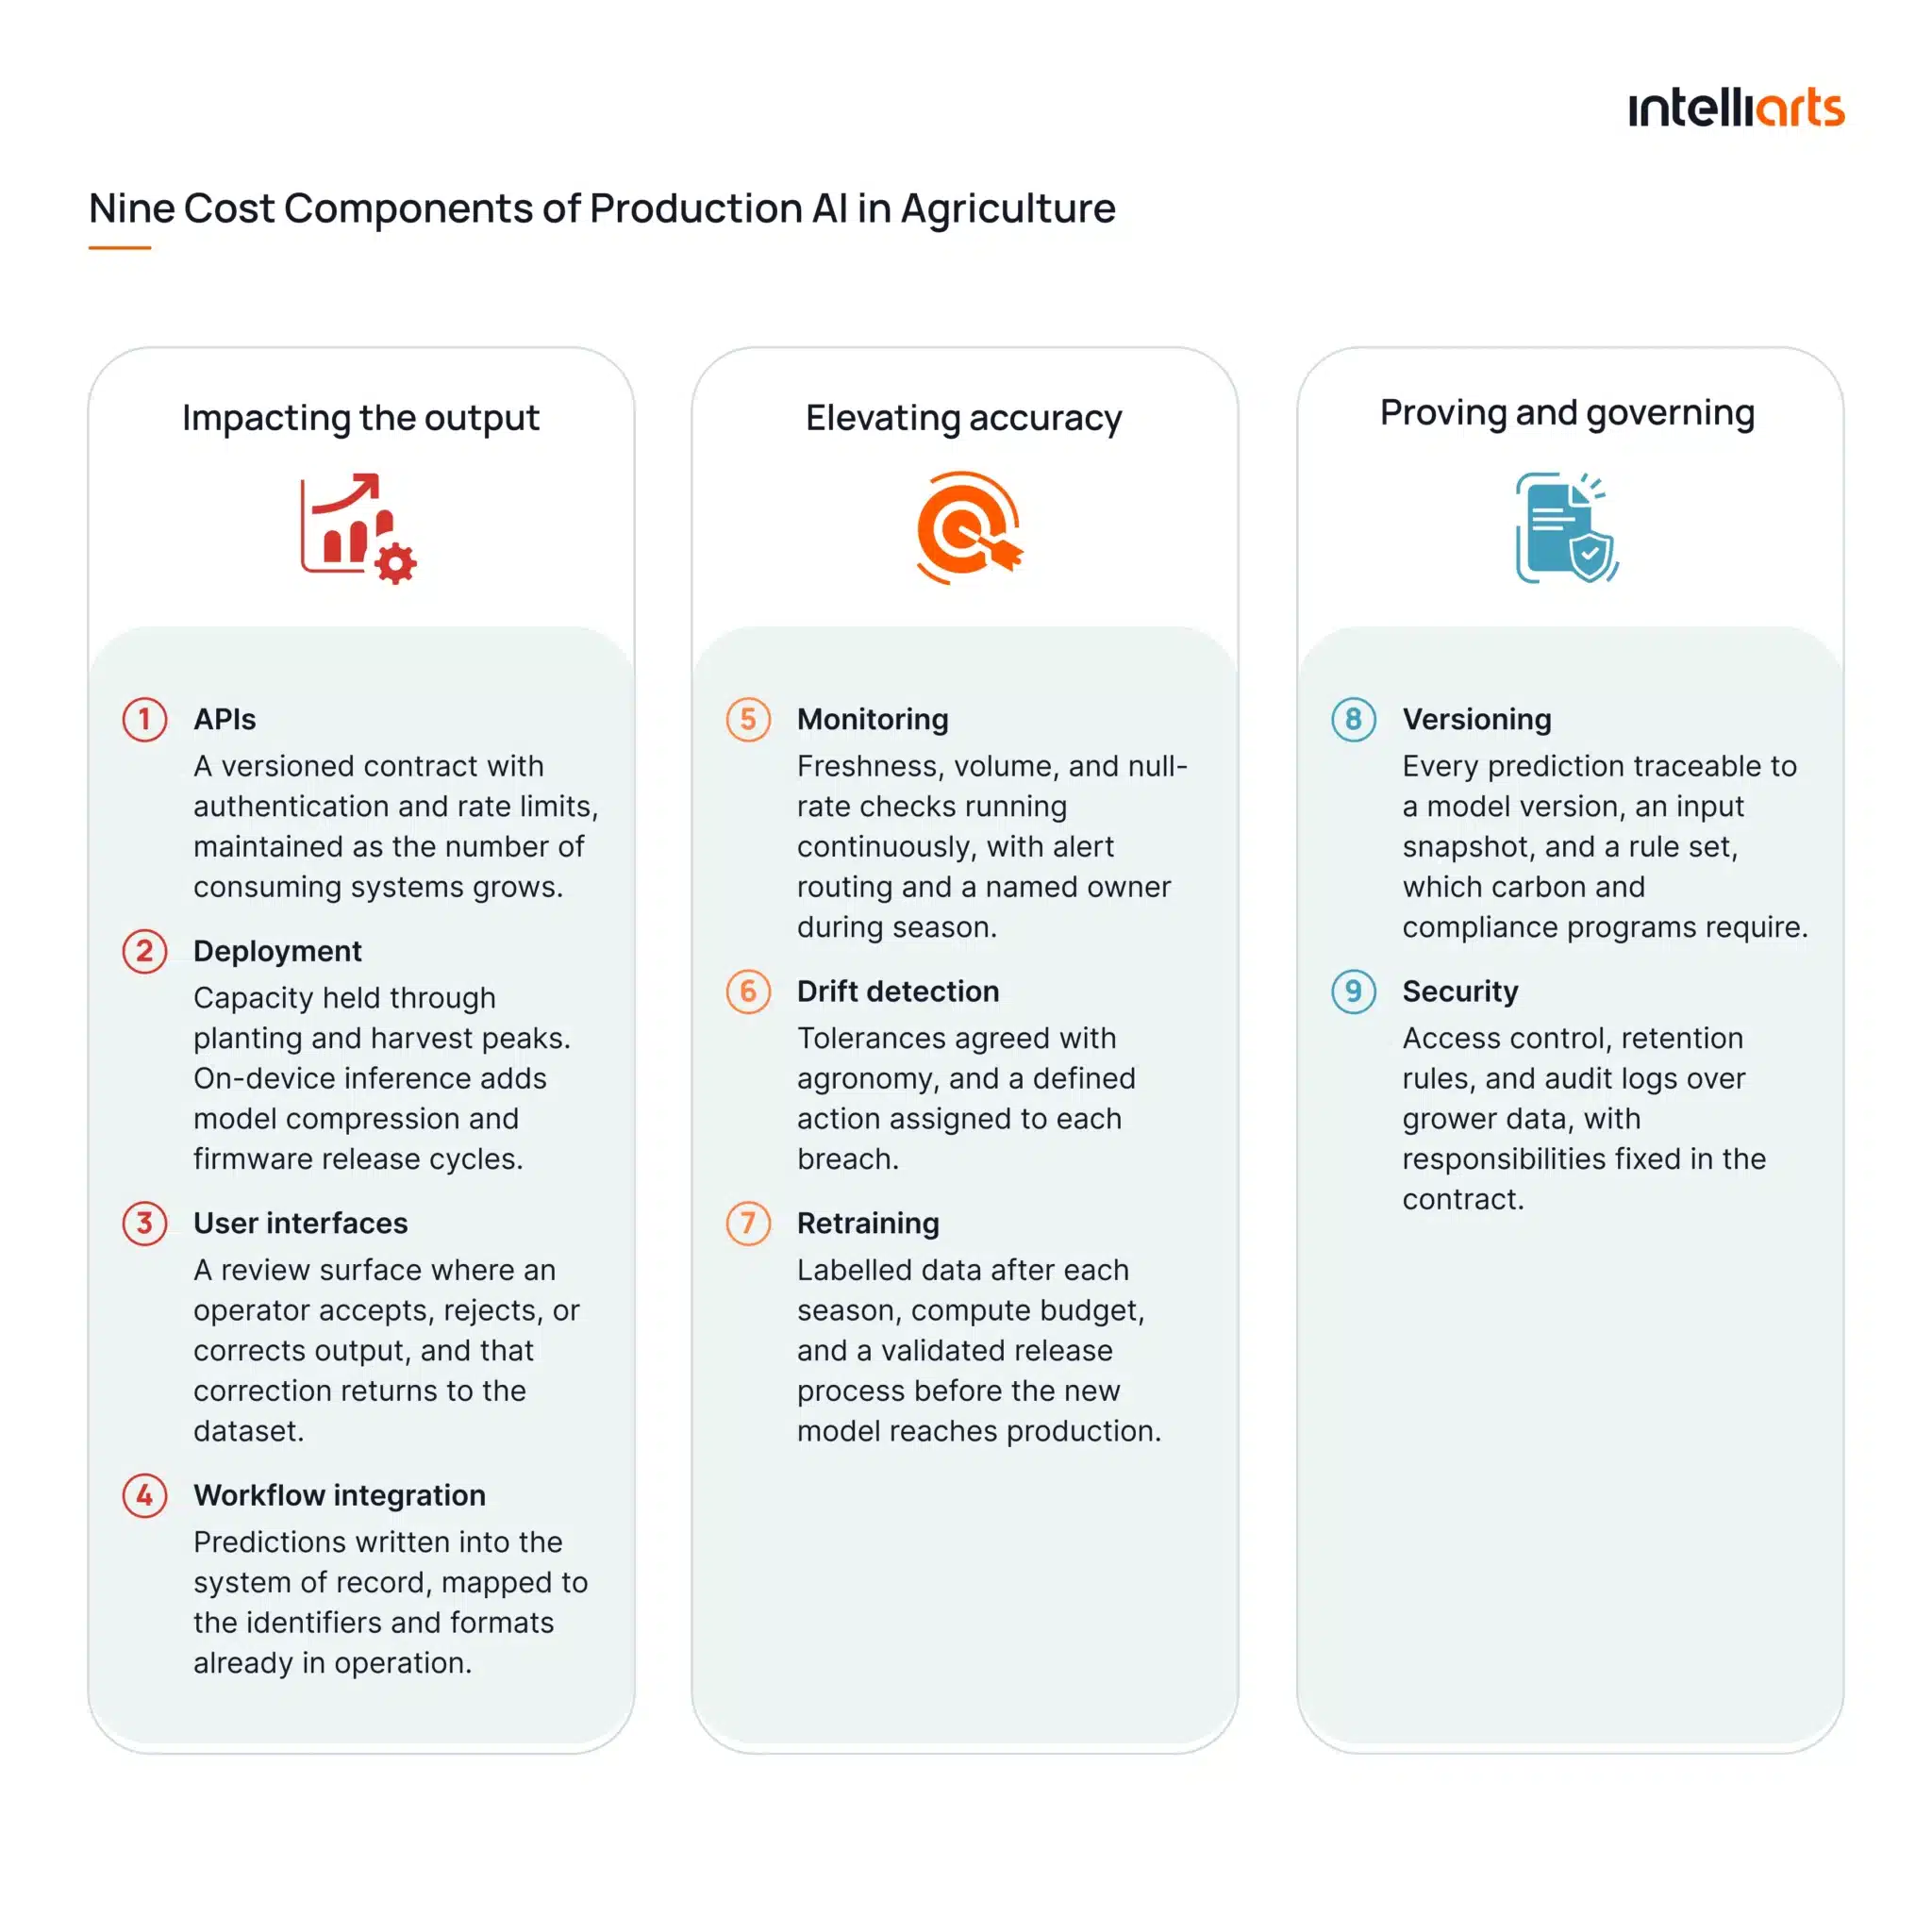
From our work in the industry, Intelliarts agritech experts advise requesting hours per component instead of one project total if there’s any uncertainty about scope or budget.
That breakdown shows where a proposal assumes ideal conditions, particularly around data preparation and integration testing. It also gives your team a basis for comparison when several agritech vendors respond to the same brief.
How to reduce agritech software development costs
Cost is reduced by limiting the first release to one decision and verifying its assumptions before the build is contracted. Three delivery routes follow from that verification, and they differ in scope, timeline, and the recurring cost that remains after launch.
The decision tree below sets out four questions in the order that determines the budget:
- Success metrics
- State of the data
- Availability of alternatives
- Model feasibility
The route reached at the end defines what is built now, what is deferred, and what remains as recurring cost. Supporting cost-reduction factors are provided within the specified routes:
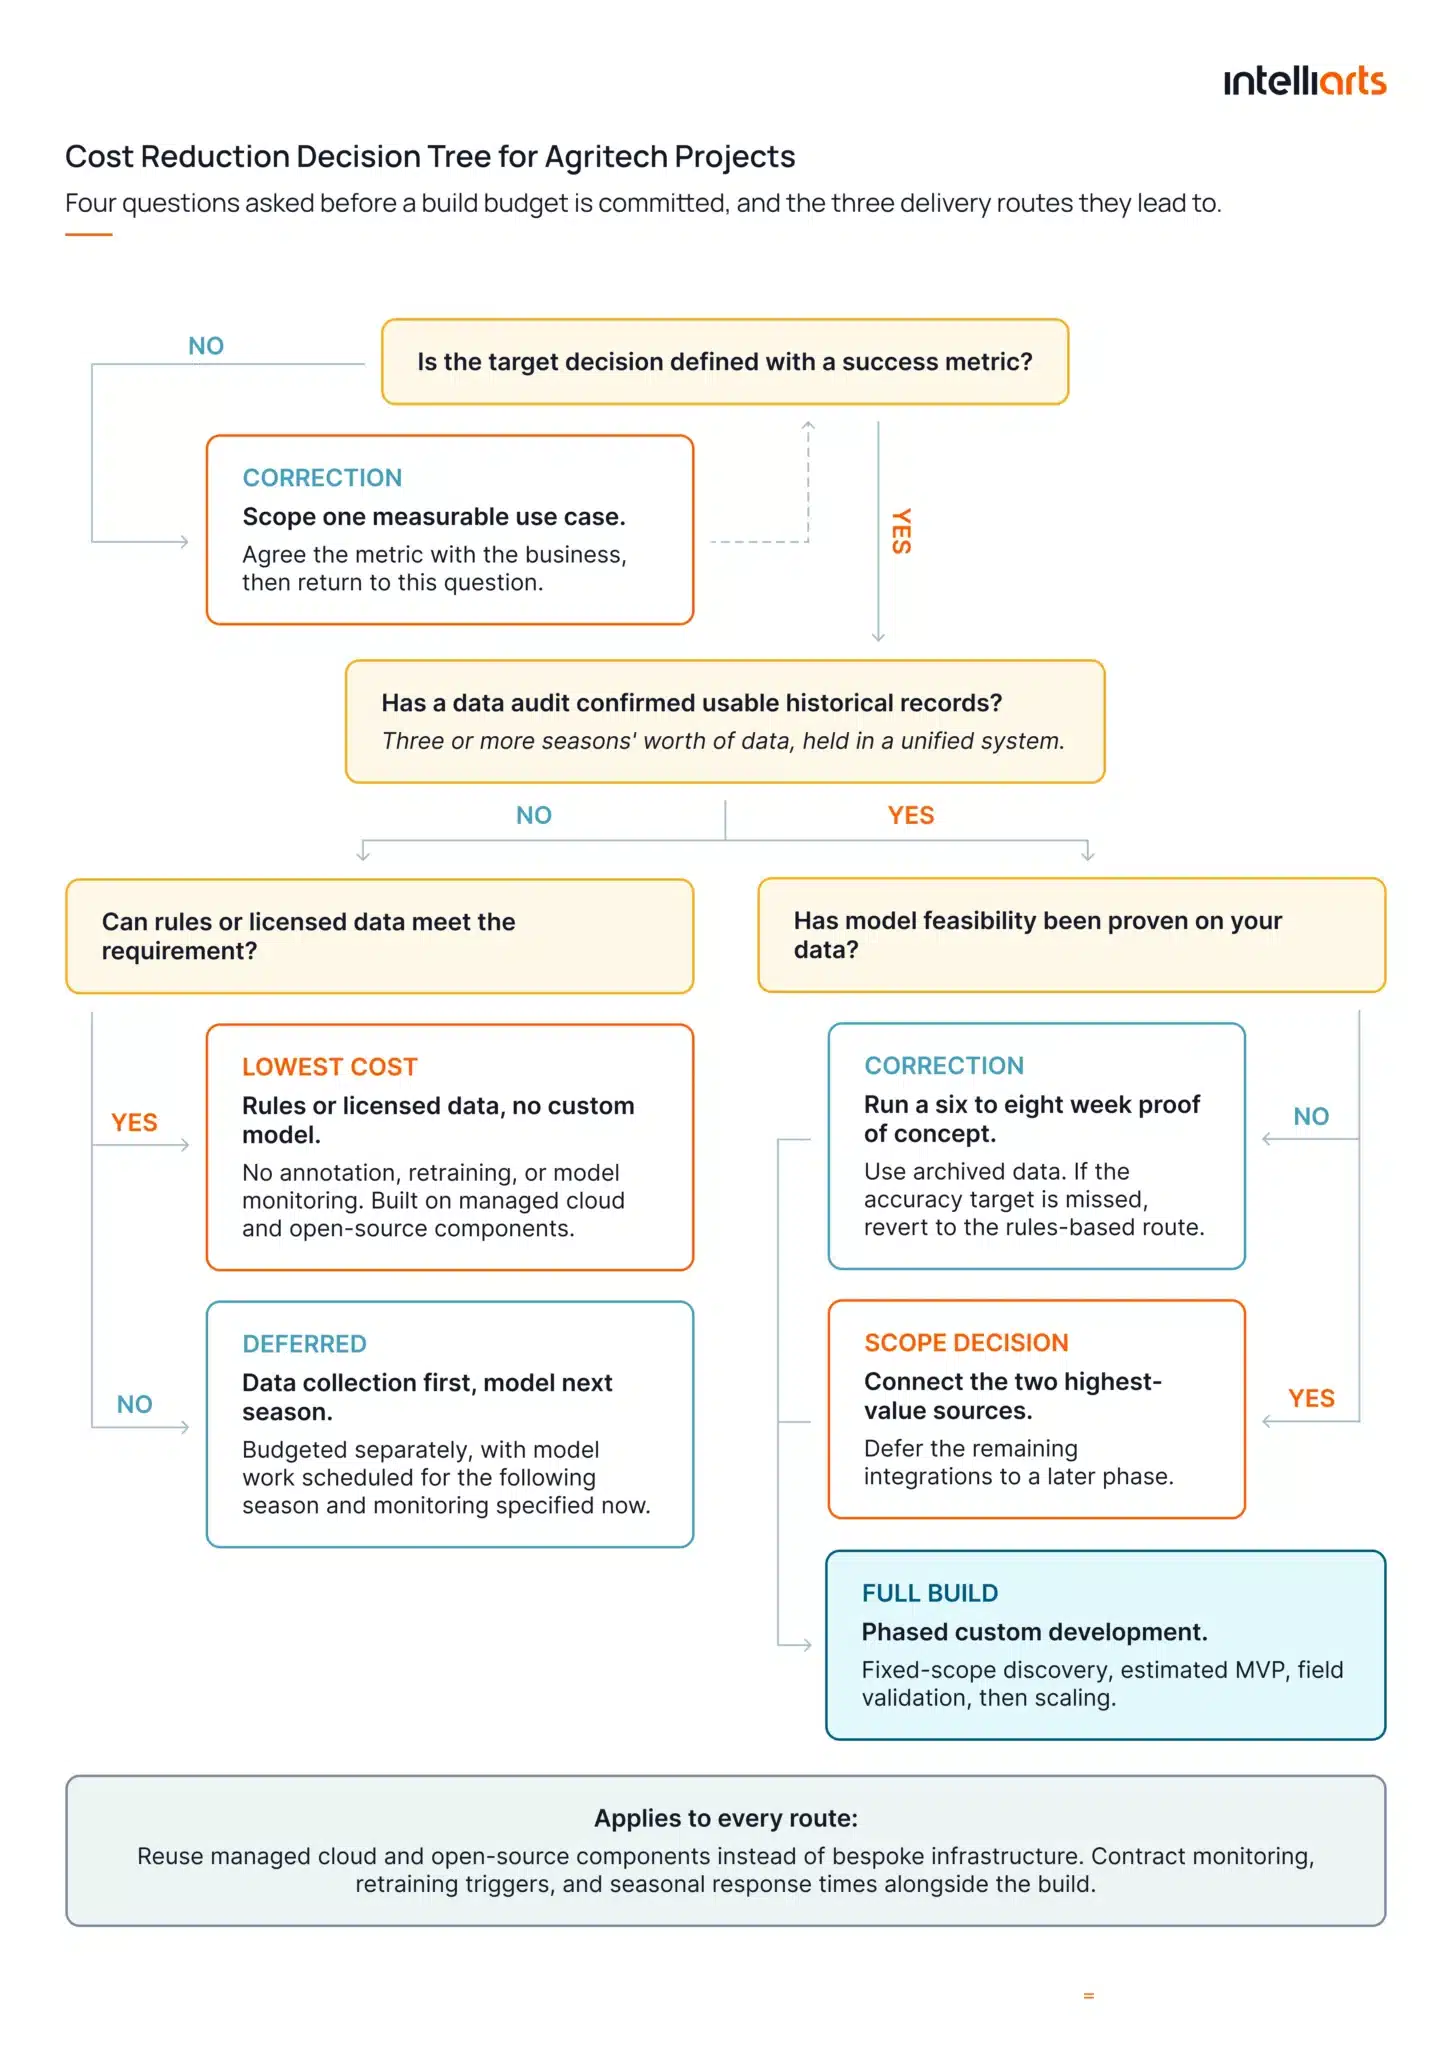
Published ranges cover the build alone, while cloud, imagery, licenses, and retraining sit inside total cost of ownership on top of them. Because those amounts differ by project, discovery establishes which of them apply, and the pricing model is selected per phase.
Savings come from narrowing the first release to one measurable use case, since fewer sources lower agritech data pipeline cost more than reducing features does.
Final take
Custom agritech software cost is set by scope, data readiness, agritech data pipeline cost, AI complexity, infrastructure, and the support contracted after launch.
Published ranges cover the build alone, so total cost of ownership, as well as cloud, imagery, licenses, and agritech data pipeline cost and retraining, are on top of them. Because those amounts differ by project, discovery establishes which of them apply, and the pricing model is then selected per phase.
Estimating and handling agritech projects end-to-end is routine for the Intelliarts team. Over more than 27 years, we have been delivering AI, ML, and data engineering solutions to businesses worldwide, and agritech remains one of our core domains.
With a 90% customer return rate and more than 92% of senior engineers in-house, we are ready to contribute to your best project with our vast expertise and experience.
Explore how a proof of concept scoped at six to eight weeks helps to determine whether your software performance target is reachable before scaling.
Looking for a qualified vendor for your agritech project assessment?
Contact us
FAQ
How much does it cost to build custom agritech software?
Agritech software development cost depends first on scope, because a two-week data audit and a multi-year enterprise ecosystem are present at opposite ends of the range. Data condition and AI complexity then shift the figure further, so Intelliarts validates every range per project.
How much does it cost to build a custom agritech data pipeline?
Agritech data pipeline cost follows the number of sources and how often they deliver data. Batch ingestion from a few APIs stays modest, while real-time sensor and satellite streams need geospatial processing and monitoring, which raises the total considerably.
What drives the price of a custom AI model for agriculture?
AI development cost for agriculture starts with data readiness, because unlabeled or incomplete records must be prepared before training. Model type then sets the next step, since computer vision and remote sensing demand more compute and validation than forecasting.