
TL;DR
- Most agricultural sensor data problems start upstream, while their cost appears downstream. Small field-level errors can distort analytics or ML without looking obviously invalid.
- Missing data should be handled based on its cause. Interpolation can help in suitable gaps, but it can also hide uncertainty.
- Data normalization does not guarantee trustworthy data. Provenance must survive transformation so each value remains traceable.
- Reliable IoT pipelines should expect connectivity and processing failures. Buffering, replay, and observability help keep those failures recoverable.
- ML systems need visibility into data quality. Raw, corrected, and imputed values should remain distinguishable throughout the pipeline.
European Commission JRC study found that 79% of surveyed EU farmers already use at least one crop-specific digital technology. The study covered 1,444 farms across nine EU countries, showing how deeply data-driven systems have already entered day-to-day crop production.
As more agricultural decisions depend on sensor-fed systems, collecting data is only part of the challenge. The harder question is whether that data remains trustworthy once it enters the pipeline.
This article examines six major causes of agricultural IoT sensor data issues and shows how to prevent them from affecting downstream decisions.
What causes sensor data quality issues in the field?
Field sensor data becomes unreliable when measurements are distorted or lose the context required for downstream use. The visible anomaly may appear far from the point where the data was compromised.
Most agricultural IoT data quality issues originate in one of six areas:
- Sensor calibration drift
- Missing or gapped readings
- Heterogeneous sensor formats
- Connectivity and transmission failures
- Environmental and installation problems
- Timestamp, duplication, and processing errors
However, these problems often overlap, so teams need to trace an unreliable reading from the device to its final use in analytics or ML.
Business Insider’s reporting shows that rural connectivity remains a practical constraint. Missing data, outliers, bias, and drift were identified as common faults.
Intelliarts saw these problems firsthand while centralizing almost 2,000 sensors across more than 500 fields for our agritech customer. As such, QA/QC checks covered deployment errors, inactive devices, unreliable records, and failed uploads.
Read our complete sensor inventory management system success story.
From what we observed, the visible symptom rarely reveals the source. That’s why there’s a need to help engineering teams narrow down the source before correcting or inputting the data.
The table below maps each common agricultural IoT data issue to its typical symptom, operational impact, and first diagnostic step:One pattern we have consistently observed is that teams can damage useful evidence when they start with IoT data cleaning. Interpolation may conceal a failing device, while an incorrect data normalization rule may make valid precision agriculture sensor data appear abnormal.
| Data issue | Common symptom | Impact | First check |
|---|---|---|---|
| Sensor calibration drift | Values diverge from references | Biased irrigation and yield predictions | Compare with reference data and calibration history |
| Missing or gapped readings | Expected records do not arrive | Incomplete alerts, analytics, and ML features | Check the device, gateway, transmission, and pipeline |
| Heterogeneous devices and formats | Units, schemas, or timestamps conflict | Inconsistent metrics and integrations | Validate mappings and unit conversions |
| Connectivity and transmission failures | Records arrive late, duplicated, or out of order | Stale dashboards and incorrect automation | Inspect retries, sequence IDs, and gateway buffers |
| Environmental or installation problems | Spikes, flatlines, or local anomalies appear | False field and equipment alerts | Verify placement, depth, condition, and nearby readings |
A safer diagnostic process follows the data path in order:
- Validate the source. Check whether the value is physically plausible and consistent with reference or neighboring sensors.
- Inspect transmission. Look for sequence gaps, delayed messages, retries, and duplicate deliveries.
- Review processing. Confirm unit conversions, schema mappings, timestamps, and aggregation logic.
Raw readings should remain unchanged, while corrected and imputed values should include a quality flag, rule version, and processing timestamp. That’s the traceability to aim for.
The following sections will delve deeper into the six causes mentioned above.
Building an IoT-driven agriculture solution?
Let’s make sure your data pipeline preserves the evidence you need for reliable analytics and decision-making.
Contact us
Cause 1. Sensor calibration drift
Sensor calibration drift is a gradual loss of measurement accuracy after deployment. It is particularly dangerous for agricultural IoT data quality because readings can remain plausible while accumulating enough bias to affect irrigation decisions and ML features.
The main contributors include:
- Soil characteristics. Soil texture, composition, and bulk density can change how dielectric sensors convert electrical response into volumetric water content.
- Salinity. Higher salinity increased overestimation across most tested devices; sensor-specific calibration brought seven sensors to about ±0.02 cm³/cm³ accuracy.
- Temperature and moisture conditions. Temperature extremes can increase monitoring error; long-term field research identified soil temperature as the dominant environmental factor affecting sensor accuracy.
- Ageing, contamination, and hardware degradation. Long field deployments can gradually change sensor response as components deteriorate or contact surfaces accumulate contaminants.
At this point, you are probably questioning: what does calibration drift look like in the data?
Teams should look for patterns that develop over time, especially:
- Growing offset from manual reference measurements;
- Persistent divergence from comparable nearby sensors;
- Seasonal bias that cannot be explained by weather or field operations;
- Increasing correction magnitude during repeated calibrations.
These signals matter because range checks alone may classify a biased reading as valid. For precision agriculture sensor data, historical consistency is often as useful as physical plausibility when detecting drift.
For extra information on best practices for data processing and transformation in ML, read the corresponding blog post by Intelliarts.
How to handle sensor calibration drift without degrading yield models
The first step is to establish a field baseline soon after installation. Then compare later readings against reference sensors or manual samples on a defined schedule. If several nearby devices move together, the field condition may have changed. If one sensor separates progressively, calibration becomes the stronger suspect.
Once drift is confirmed, calibration should be approached as a versioned data operation. Here’s how you can handle sensor calibration drift without degrading yield models based on Intelliarts’ experience with precision farming using IoT.
- Keep the original sensor reading unchanged so engineers can audit later corrections and compare them against the raw historical series.
- Store the corrected value separately and link it directly to the raw observation that triggered the calibration adjustment.
- Record the calibration coefficient and version so downstream systems know which correction logic produced each adjusted measurement.
- Attach the correction timestamp and a data-quality flag to distinguish verified measurements from uncertain or retrospectively adjusted values.
- Validate the corrected series against trusted references before allowing it into model retraining, feature generation, or production scoring.
This approach is also consistent with Intelliarts’ data-preparation practices, which emphasize data validation checks, continuous data profiling, and metadata management for traceability.
Cause 2. Missing or gapped sensor data
Missing sensor data appears when expected readings never reach the dataset or arrive too late for their intended use. In agriculture, these gaps can distort time-series trends, alerts, and ML features even when the sensors themselves remain operational.
Common causes include:
- Network outages. Weak or unstable connectivity can interrupt sensor uploads, leaving otherwise valid readings stranded at the edge.
- Battery or hardware failure. Power loss, resets, and damaged devices can stop sampling without generating an explicit missing-data event.
- Gateway downtime. A working sensor may disappear from the dataset when its gateway loses power, storage, or network access.
- Pipeline failures. Records can be lost after transmission because of failed ingestion jobs, processing bottlenecks, or downstream crashes.
- Damaged devices. Physical damage, moisture, corrosion, or machinery can interrupt measurements and create persistent gaps in sensor data.
- Limited rural connectivity. Weak cellular or LPWAN coverage can delay transmissions, increase packet loss, and create recurring gaps across remote fields.
- Failed API calls. Timeouts, authentication errors, or unavailable endpoints can prevent collected readings from reaching downstream applications or storage.
The scale of the problem is measurable. One LoRaWAN precision-irrigation deployment reported an average data loss rate of 5.51% across six data loggers, with gateway placement and network disconnections contributing to signal loss.
How to manage missing or gapped sensor data
First, detect gaps against the expected sampling interval, like 4 samples/hour. Second, use measures to restore smooth sensor operation, if possible. Finally, handle gaps using the recommended treatment method based on the gap type.
A regular suite of measures includes the following:
- Detecting gaps with expected sampling intervals
- Buffering readings locally at the edge
- Retrying failed transmissions
- Backfilling data when connectivity returns
- Marking missing values explicitly
- Choosing an imputation method based on the variable
- Adding data-quality flags
- Preventing imputed data from being treated as observed data
For confirmed gaps, the treatment should depend on the corresponding variable as specified in the table below:
| Gap type | Recommended treatment |
|---|---|
| Short temperature gap | Interpolate when the surrounding values change smoothly |
| Soil-moisture gap | Consider duration, rainfall, temperature, and site conditions |
| Rainfall gap | Avoid automatic linear interpolation |
| Long sensor outage | Use nearby or external data only after data validation |
| Missing event record | Keep missing when reliable reconstruction is impossible |
A USGS study across six sites found that soil-water imputation performance depended on site, depth, precipitation, temperature, and gap duration. Its dynamic model achieved R² values of 0.75–0.91, supporting the case against one universal imputation rule.
“An interesting aspect to note is that when an agricultural IoT product starts scaling, sensor maintenance can become surprisingly expensive. At some point, you need to understand which data problems actually affect business decisions and which ones can be tolerated.” — Alexander Barinov, a Managing Partner at Intelliarts
Cause 3. Heterogeneous sensor brands and data formats
Agricultural IoT platforms often combine sensors from several vendors, each with its own schema, units, interfaces, and reporting conventions. Because of that, without normalization, equivalent measurements can enter the agriculture data pipeline as technically different records.
Typical inconsistencies include:
- Units. Celsius, Fahrenheit, pressure scales, moisture conventions.
- Field names. Different labels for identical measurements.
- Sampling frequencies. Different intervals between sensor readings.
- APIs. Different endpoints, authentication, limits, payloads.
- Communication protocols. MQTT, HTTP, LoRaWAN, proprietary gateways.
- Precision levels. Different resolution, decimals, and uncertainty.
- Metadata standards. Inconsistent device and calibration context.
- Time zones. Local time, UTC offsets, DST.
You can also explore how software connects these data sources in our overview of top precision agriculture tools.
This interoperability problem is established well beyond agriculture. The OGC SensorThings API specifically defines a standardized way to manage observations and metadata from heterogeneous IoT sensor systems, using a common model for sensors, observations, properties, locations, and data streams.
How to normalize data from heterogeneous IoT sensor brands
Normalize heterogeneous sensor data by translating every vendor payload into one canonical schema before it reaches analytics, automation, or ML workloads. Vendor-specific details should remain traceable, but downstream systems should consume one consistent representation.
A practical normalization layer should:
- Define a canonical data model for timestamp, measurement type, value, unit, device identity, location, and quality metadata.
- Map vendor-specific fields into that model, so fields such as temp, temperature_c, and soilTemp resolve to one internal attribute.
- Standardize measurement units during ingestion and retain the original unit so conversions remain auditable and reversible.
- Convert timestamps to UTC while preserving the source timestamp and offset when they are needed for debugging or compliance.
- Preserve original device identifiers alongside internal IDs, preventing normalization from breaking traceability back to the physical sensor.
- Attach sensor metadata such as type, model, firmware version, field location, and calibration state to each relevant datastream.
- Validate acceptable ranges after conversion because unit or mapping errors can otherwise produce syntactically valid but physically impossible measurements.
- Version transformation rules so historical records can always be tied to the mapping and conversion logic used at ingestion time.
- Retest vendor integrations after firmware or API updates to catch schema and payload changes before they affect normalized data.
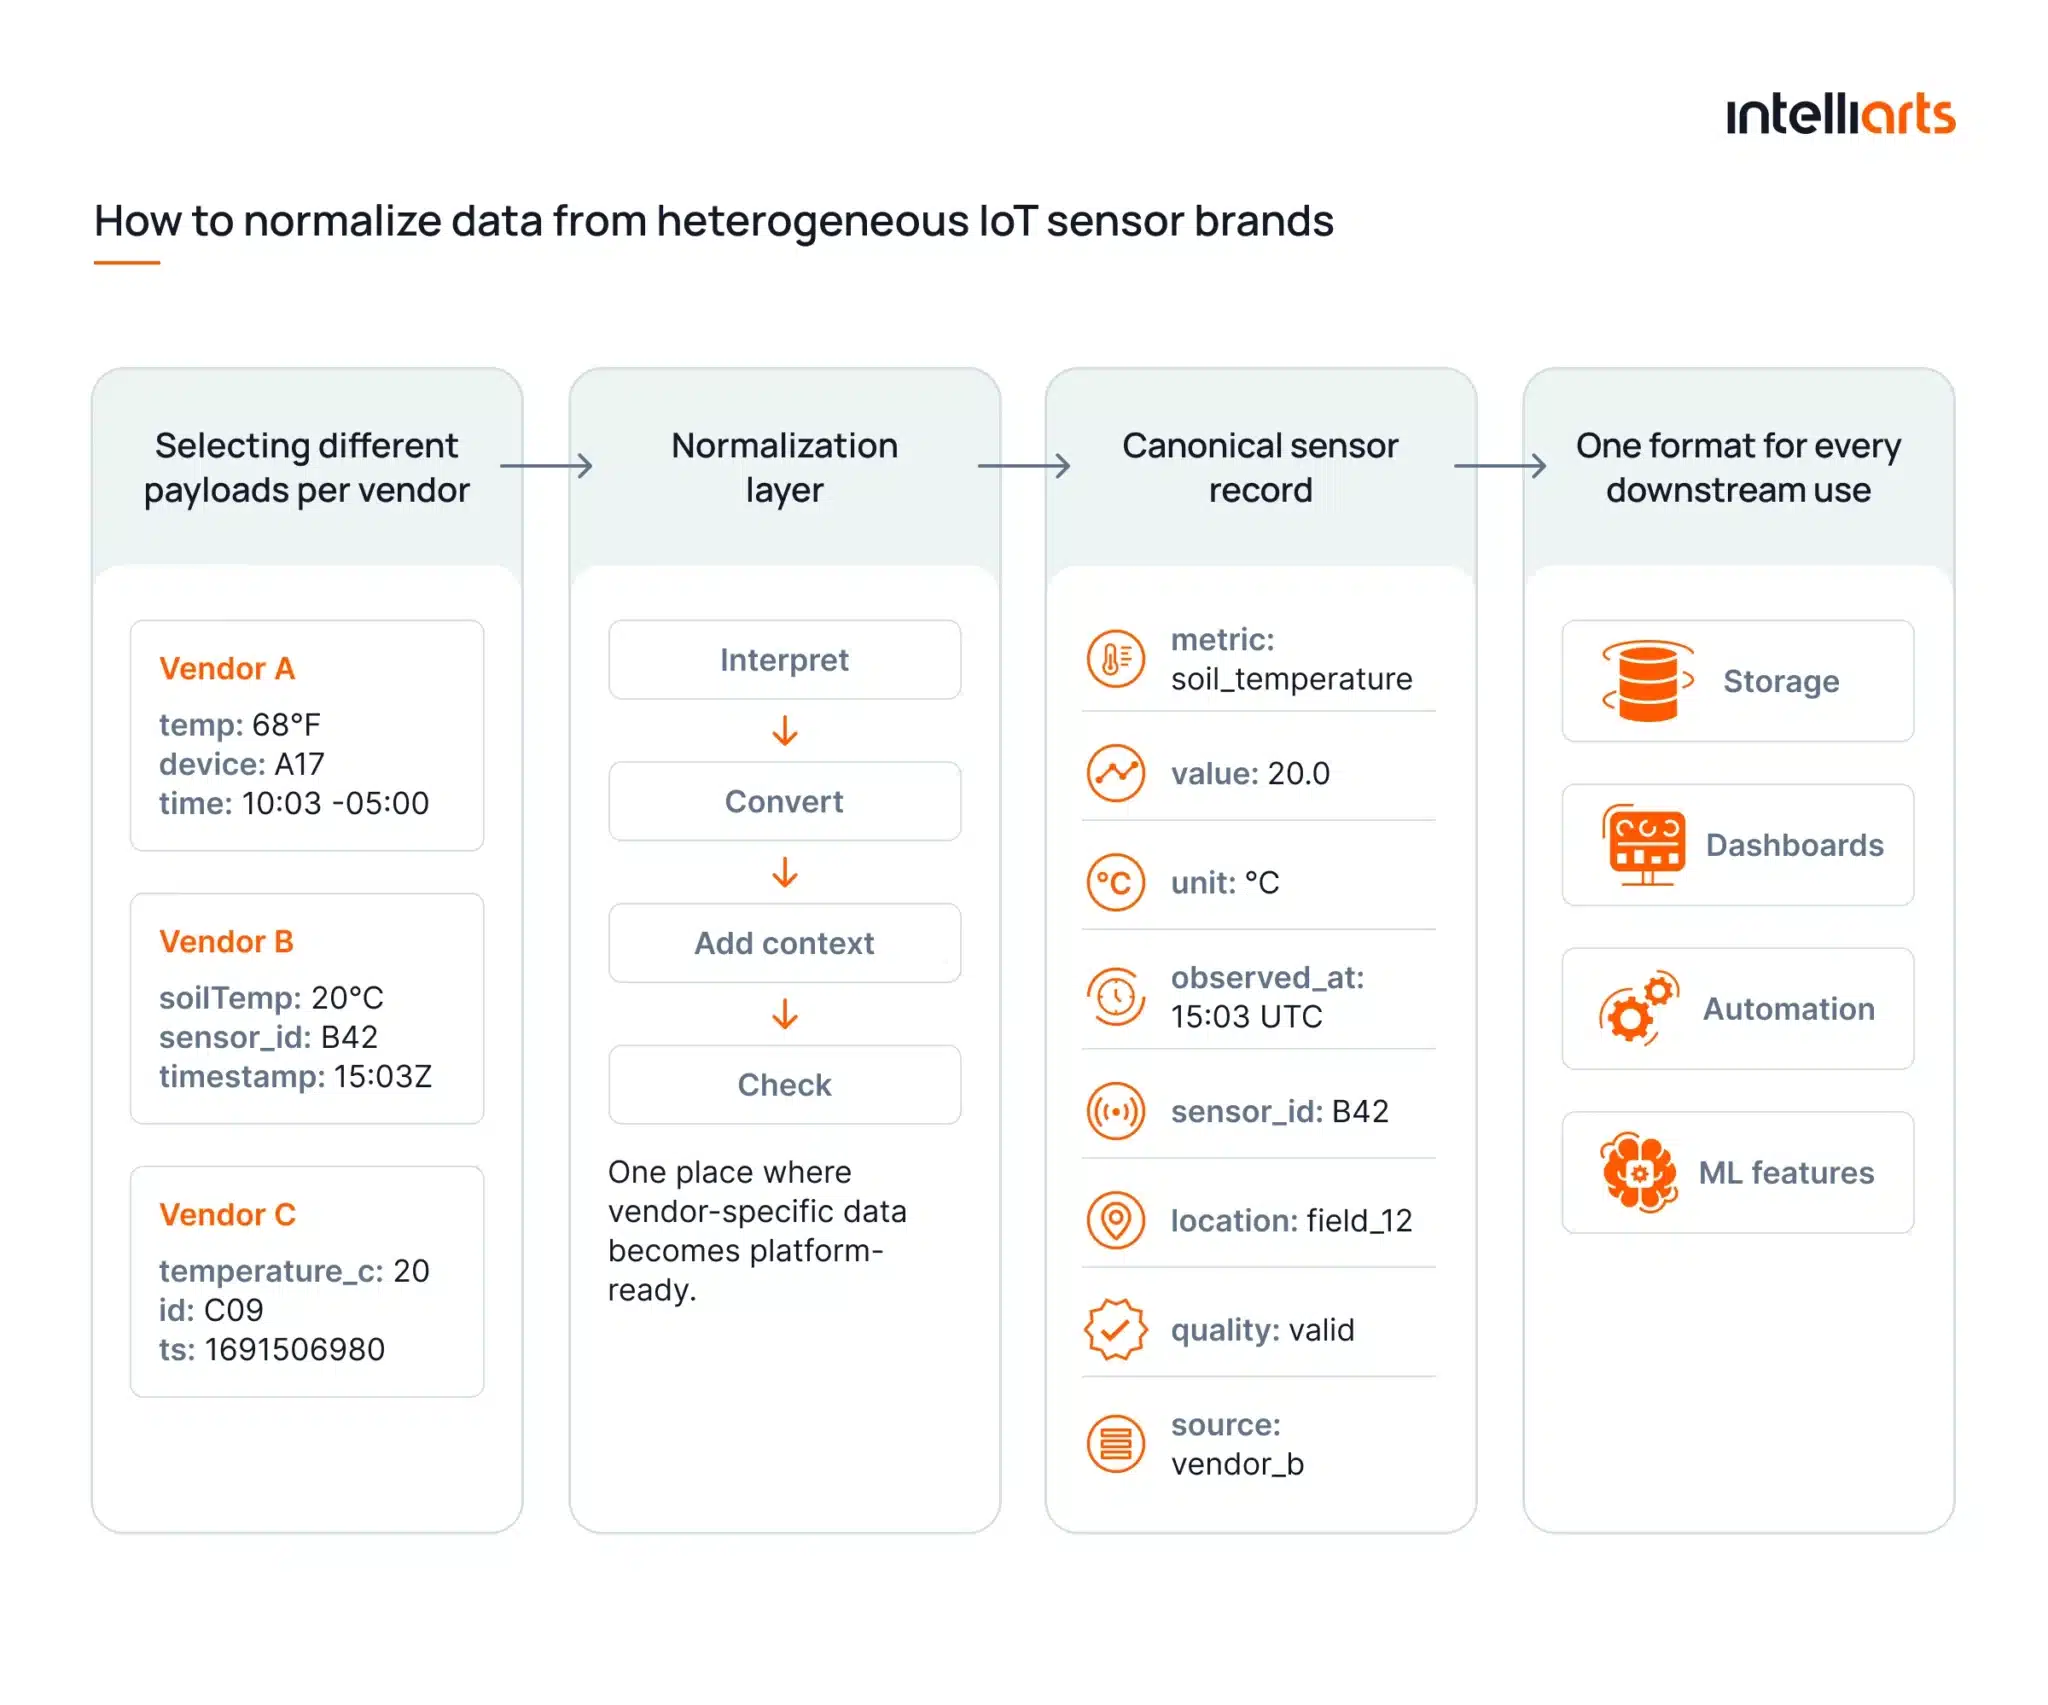
From our work with data-heavy agricultural systems, the same principle applies even when teams use a custom schema.
Intelliarts’ agriculture interoperability guidance recommends standardizing units and timestamps while retaining source tagging when data arrives through IoT devices, APIs, and other operational systems.
Want to see how Intelliarts addressed sensor quality in a production agritech platform? Read our agritech case study.
Cause 4. Connectivity and data transmission failures
Agricultural sensors often operate far from stable network infrastructure. Weak coverage, poor gateway placement, limited bandwidth, interference, and power constraints can interrupt transmission even when devices continue collecting valid data.
Common effects of connectivity and data transmission include:
- Delayed readings as well as stale or late data.
- Packet loss, which usually looks like incomplete time-series data.
- Out-of-order records, which can appear as a broken event sequence.
- Duplicate transmissions resulting in inflated event counts.
- Complete data loss or partially unrecoverable readings.
Rural connectivity remains a practical constraint for precision agriculture. From what Intelliarts observed in our agriculture projects, a lot of farmers still face weak cellular and other connectivity in remote areas.
Deployment conditions matter as well. LoRaWAN study showed that gateway placement on natural elevations improved rural coverage.
To make transmission more resilient:
- Buffer readings locally during outages
- Retry failed transmissions with controlled backoff
- Acknowledge delivery of critical messages
- Use idempotent ingestion and sequence numbers
- Preserve original event timestamps
- Compress payloads on constrained networks
- Monitor signal, queues, gateways, and batteries
- Match protocols to range and power needs
AWS also recommends store-and-forward architecture, retry logic, and reconnect monitoring for intermittently connected IoT devices. Although it’s a concern, rather for your trusted software engineering partner that will be working on your agricultural IoT project.
Learn about Intelliarts' experience with agriculture and agritech projects.
Our team has worked with large farming and agritech businesses to boost cost-effectiveness.
Explore our AgTech expertise
Cause 5. Environmental conditions and incorrect sensor installation
Even correctly calibrated sensors can produce unreliable readings when field conditions or installation distort what they measure. Placement errors are especially problematic because they may create consistent, believable bias instead of obvious failures.
Typical causes include:
- Poor sensor placement outside representative field zones
- Incorrect installation depth for the crop root zone
- Air gaps or weak soil-to-sensor contact
- Water ingress and physical damage
- Direct sunlight affecting exposed sensors
- Obstruction by vegetation or debris
- Damage from animals or farm machinery
- Local microclimates unrepresentative of the wider field
For soil-moisture sensors, installation quality directly affects accuracy. Field guidance from the University of Arizona also identifies soil variability, extreme temperatures, physical damage, and installation quality as recurring reliability issues.
Before deployment, field controls should verify that each sensor is installed where its readings remain representative and physically reliable. This is especially important for soil sensors, where placement and soil contact directly affect measurement accuracy.
A practical field-control process should:
- Standardize installation procedures for depth, orientation, spacing, and soil contact.
- Record location and installation depth as part of sensor metadata.
- Validate readings after deployment before using them for automation or analytics.
- Compare nearby sensors to detect isolated spikes, flatlines, or persistent divergence.
- Schedule physical inspections for exposed, damaged, shifted, or obstructed devices.
- Use redundancy for critical measurements where a single faulty sensor could trigger costly actions.
- Link maintenance records to sensor history so anomalies can be traced back to field interventions
Installation metadata matters downstream as well. As the experience of Intelliarts engineers confirms, reading from the wrong depth may be technically valid yet represent a different soil layer than the model expects.
That’s why we make an extra effort to provide the context needed to trace anomalies and protect downstream analytics.
Cause 6. Timestamp, duplication, and data processing errors
Pipeline-level errors can affect otherwise valid sensor readings after they are transmitted from field devices. The main risk is semantic corruption: valid telemetry can be assigned to the wrong event-time window, counted more than once, or processed under outdated schema logic.
Here are the adverse effects of common failure types:
- Timezone mismatches and clock drift can place readings in the wrong analytical window.
- Duplicate delivery after retries can inflate counts, averages, or event-based metrics.
- Late and out-of-order events may arrive after downstream aggregates have already been calculated.
- Schema and transformation changes can silently alter field meanings, types, or derived values.
- Failed batch jobs can leave partial datasets or stale downstream tables.
Time handling deserves particular attention. Apache Beam distinguishes event time from processing time because records are not guaranteed to be processed in event-time order.
Its guidance on watermarks and late data shows why pipelines need explicit rules for records that arrive after a window has closed.
A reliable processing layer should:
- Normalize timestamps to UTC before cross-device aggregation.
- Keep event and ingestion time separately to expose transmission and processing delays.
- Assign unique event IDs and apply deterministic deduplication rules.
- Handle late records explicitly through watermarks, correction windows, or controlled recomputation.
- Version and validate schemas before new payload structures reach production transformations.
- Preserve raw data so failed transformations can be reproduced and corrected.
- Monitor pipeline health through freshness, failure, duplicate, and late-arrival metrics.
From Intelliarts’ data engineering work, observability is equally important once the pipeline scales.
Read our blog post on best practices to scale and optimize data pipelines for more information on how to detect defects before they impact analytics or ML outputs.
How to build a reliable IoT sensor data pipeline for agriculture
For teams building an IoT sensor data pipeline, agriculture introduces additional reliability requirements because telemetry originates in distributed field environments. It’s typically enforced through the following pipeline layers:
- Sensor and device layer
- Gateway or edge layer
- Secure ingestion layer
- Raw storage layer
- Data validation layer
- Data normalization layer
- Analytics and ML pipelines
- Monitoring layer
- Application layer
For smart farming data management, this architecture also makes data-quality failures visible before they affect downstream decisions.
See the structure of a reliable IoT sensor data pipeline in the infographics below:
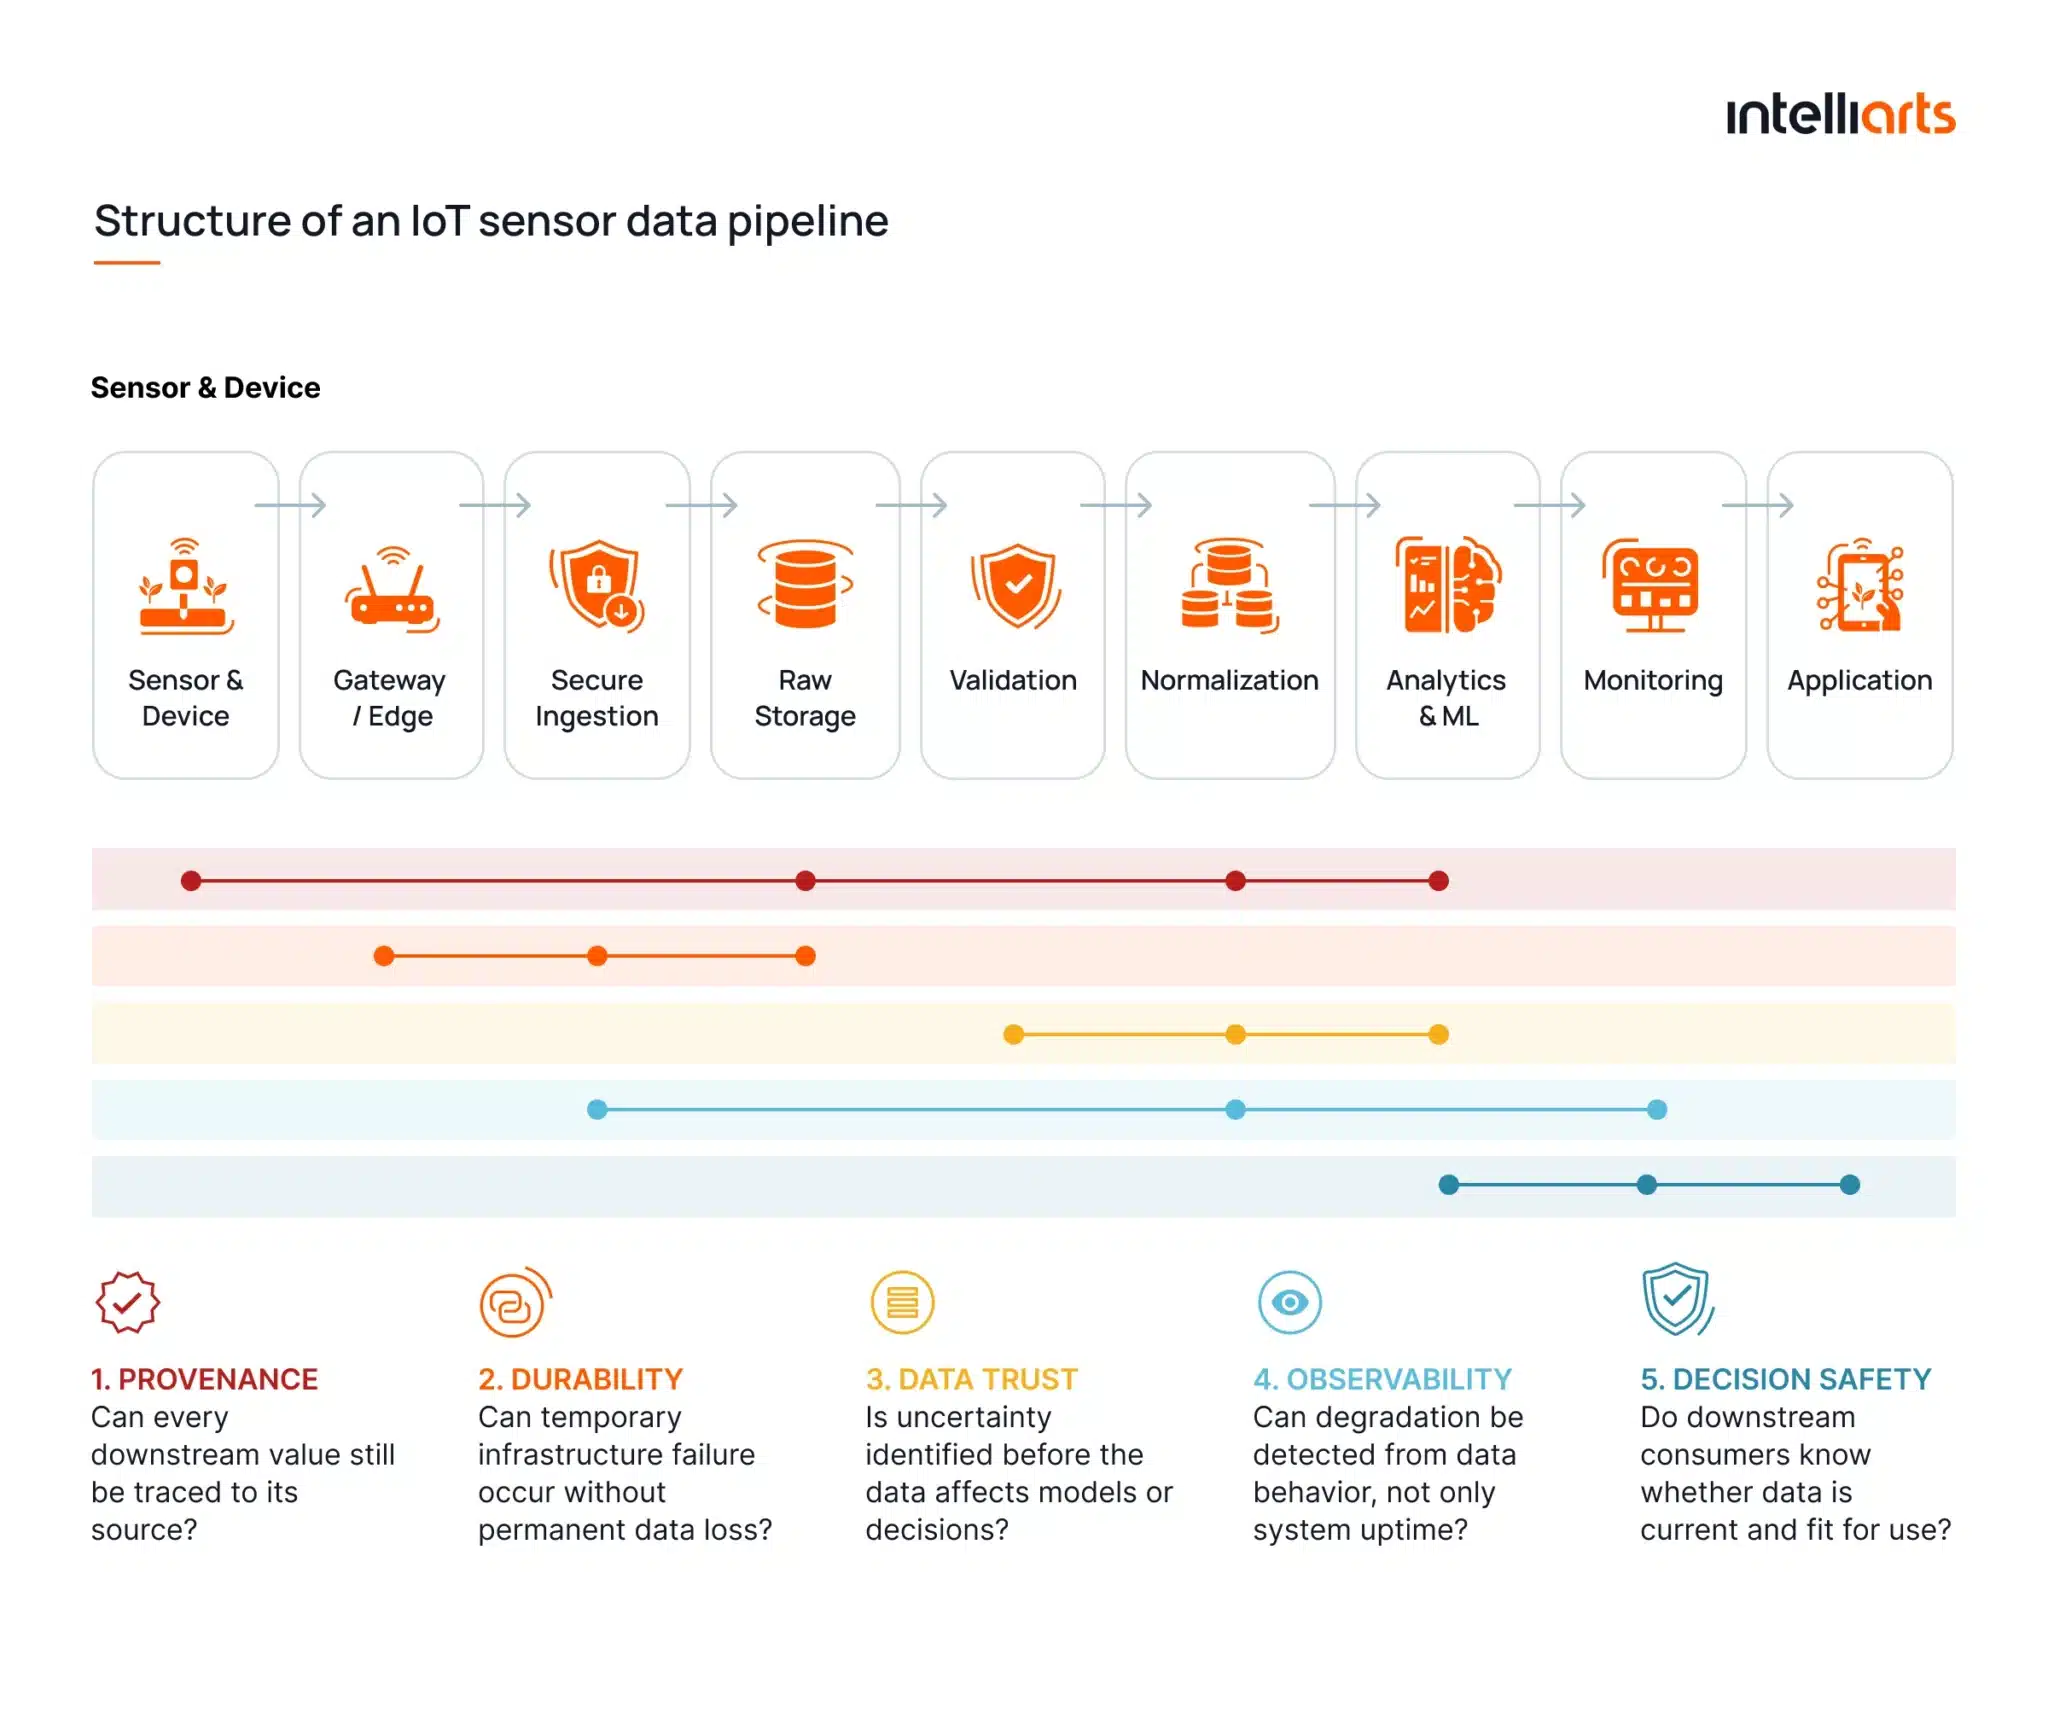
Architecture defines where reliability is enforced. But it’s equally important to see whether those controls are actually holding. The table below maps each data-quality dimension to its enforcement point and a metric that can be tracked in production.
| Control | What it verifies | Where to enforce it | Metric |
|---|---|---|---|
| Completeness | Expected observations arrived | Ingestion and validation | Received records / expected records × 100% |
| Accuracy | Measurements remain credible against references | Validation | Sum of absolute measurement errors / number of measurements |
| Timeliness | Data arrives within its useful decision window | Ingestion and streaming | 95th percentile of ingestion time — event time |
| Consistency | Units, fields, and metadata remain aligned | Normalization | Conforming records / total processed records × 100% |
| Validity | Values satisfy physical and agronomic rules | Validation | Records passing validation rules / total records × 100% |
| Uniqueness | Retries do not create repeated observations | Ingestion | Unique event identifiers / total event identifiers × 100% |
| Traceability | Records retain source and processing context | Storage and transformation | Records with complete provenance metadata / total records × 100% |
| Schema compatibility | Producer changes remain readable downstream | Ingestion and normalization | Schema-compatible records / total ingested records × 100% |
| Recoverability | Failed processing can be replayed safely | Storage and processing | Successfully restored records / replayed records × 100% |
Based on Intelliarts’ data engineering work, pipeline reliability also depends on observability at each processing stage. In our blog post on how we built a big data pipeline, we explain data transformation, DevOps, and security aspects, as well as how to get more business value out of processing data.
How sensor data quality affects agricultural ML models
Sensor quality affects agricultural ML at two levels: the prediction produced today and the relationships the model learns for future decisions. Errors that look minor in telemetry can become systematic once they enter training data or feature pipelines.
These data-quality requirements also underpin broader AI in agriculture use cases.
The immediate impact varies by workload:
- Yield prediction: Calibration bias can distort moisture and weather features used to estimate yield.
- Irrigation recommendations: Stale or imputed readings can represent field conditions that have already changed.
- Crop stress detection: Spikes and sensor noise can resemble genuine physiological stress.
- Equipment failure prediction: Missing or reordered telemetry can break temporal degradation patterns.
- Pest and disease alerts: Incorrect timestamps or locations can associate environmental conditions with the wrong event.
These downstream effects are only the visible symptoms. At the ML-engineering level, the larger concern is how sensor errors propagate into training distributions, feature pipelines, and production model behavior.
“For some ML projects, especially those that are just slowly getting up and running, bad sensor data is a major money-wasting factor. Basically, even a poorly trained model has never been such a huge issue compared to unusable real-life data.” — Mariana Franchuk, Agritech Solution Expert at Intelliarts
In production MLOps, this means monitoring the data feeding the model as closely as the model itself.
- Historical bias and false correlations. Repeated sensor error can become embedded in the training dataset and appear statistically related to yield, stress, or disease outcomes.
- Training-serving skew and regional accuracy. When production feature distributions diverge from training data, performance can deteriorate across new fields, regions, or seasons. Google approaches training-serving skew as a distinct production monitoring problem.
- Model drift. Sensor replacement, aging, or changing field conditions can alter production feature distributions over time, even when the deployed model remains unchanged.
- Data-quality features and confidence scores. Quality flags, imputation status, and confidence estimates give models additional context about input reliability.
Based on Intelliarts’ experience, raw, corrected, and imputed values should also remain distinguishable before feature generation. Otherwise, preprocessing can hide uncertainty that the model and monitoring layer still need.
Want to turn agricultural sensor data into reliable ML predictions?
We can help you build the data pipelines, quality controls, and MLOps infrastructure.
Let's talk
Agricultural sensor data quality checklist
Picture this: by the time poor sensor data appears as training-serving skew or model drift, the failure may have already propagated through your storage, transformations, feature generation, and production inference.
At that point, teams need to determine whether the degradation comes from the model, the data pipeline, or the physical sensing layer.
A useful data-quality review, therefore, has to follow each observation end to end. To help with this, the Intelliarts team prepared an agricultural sensor data quality checklist:
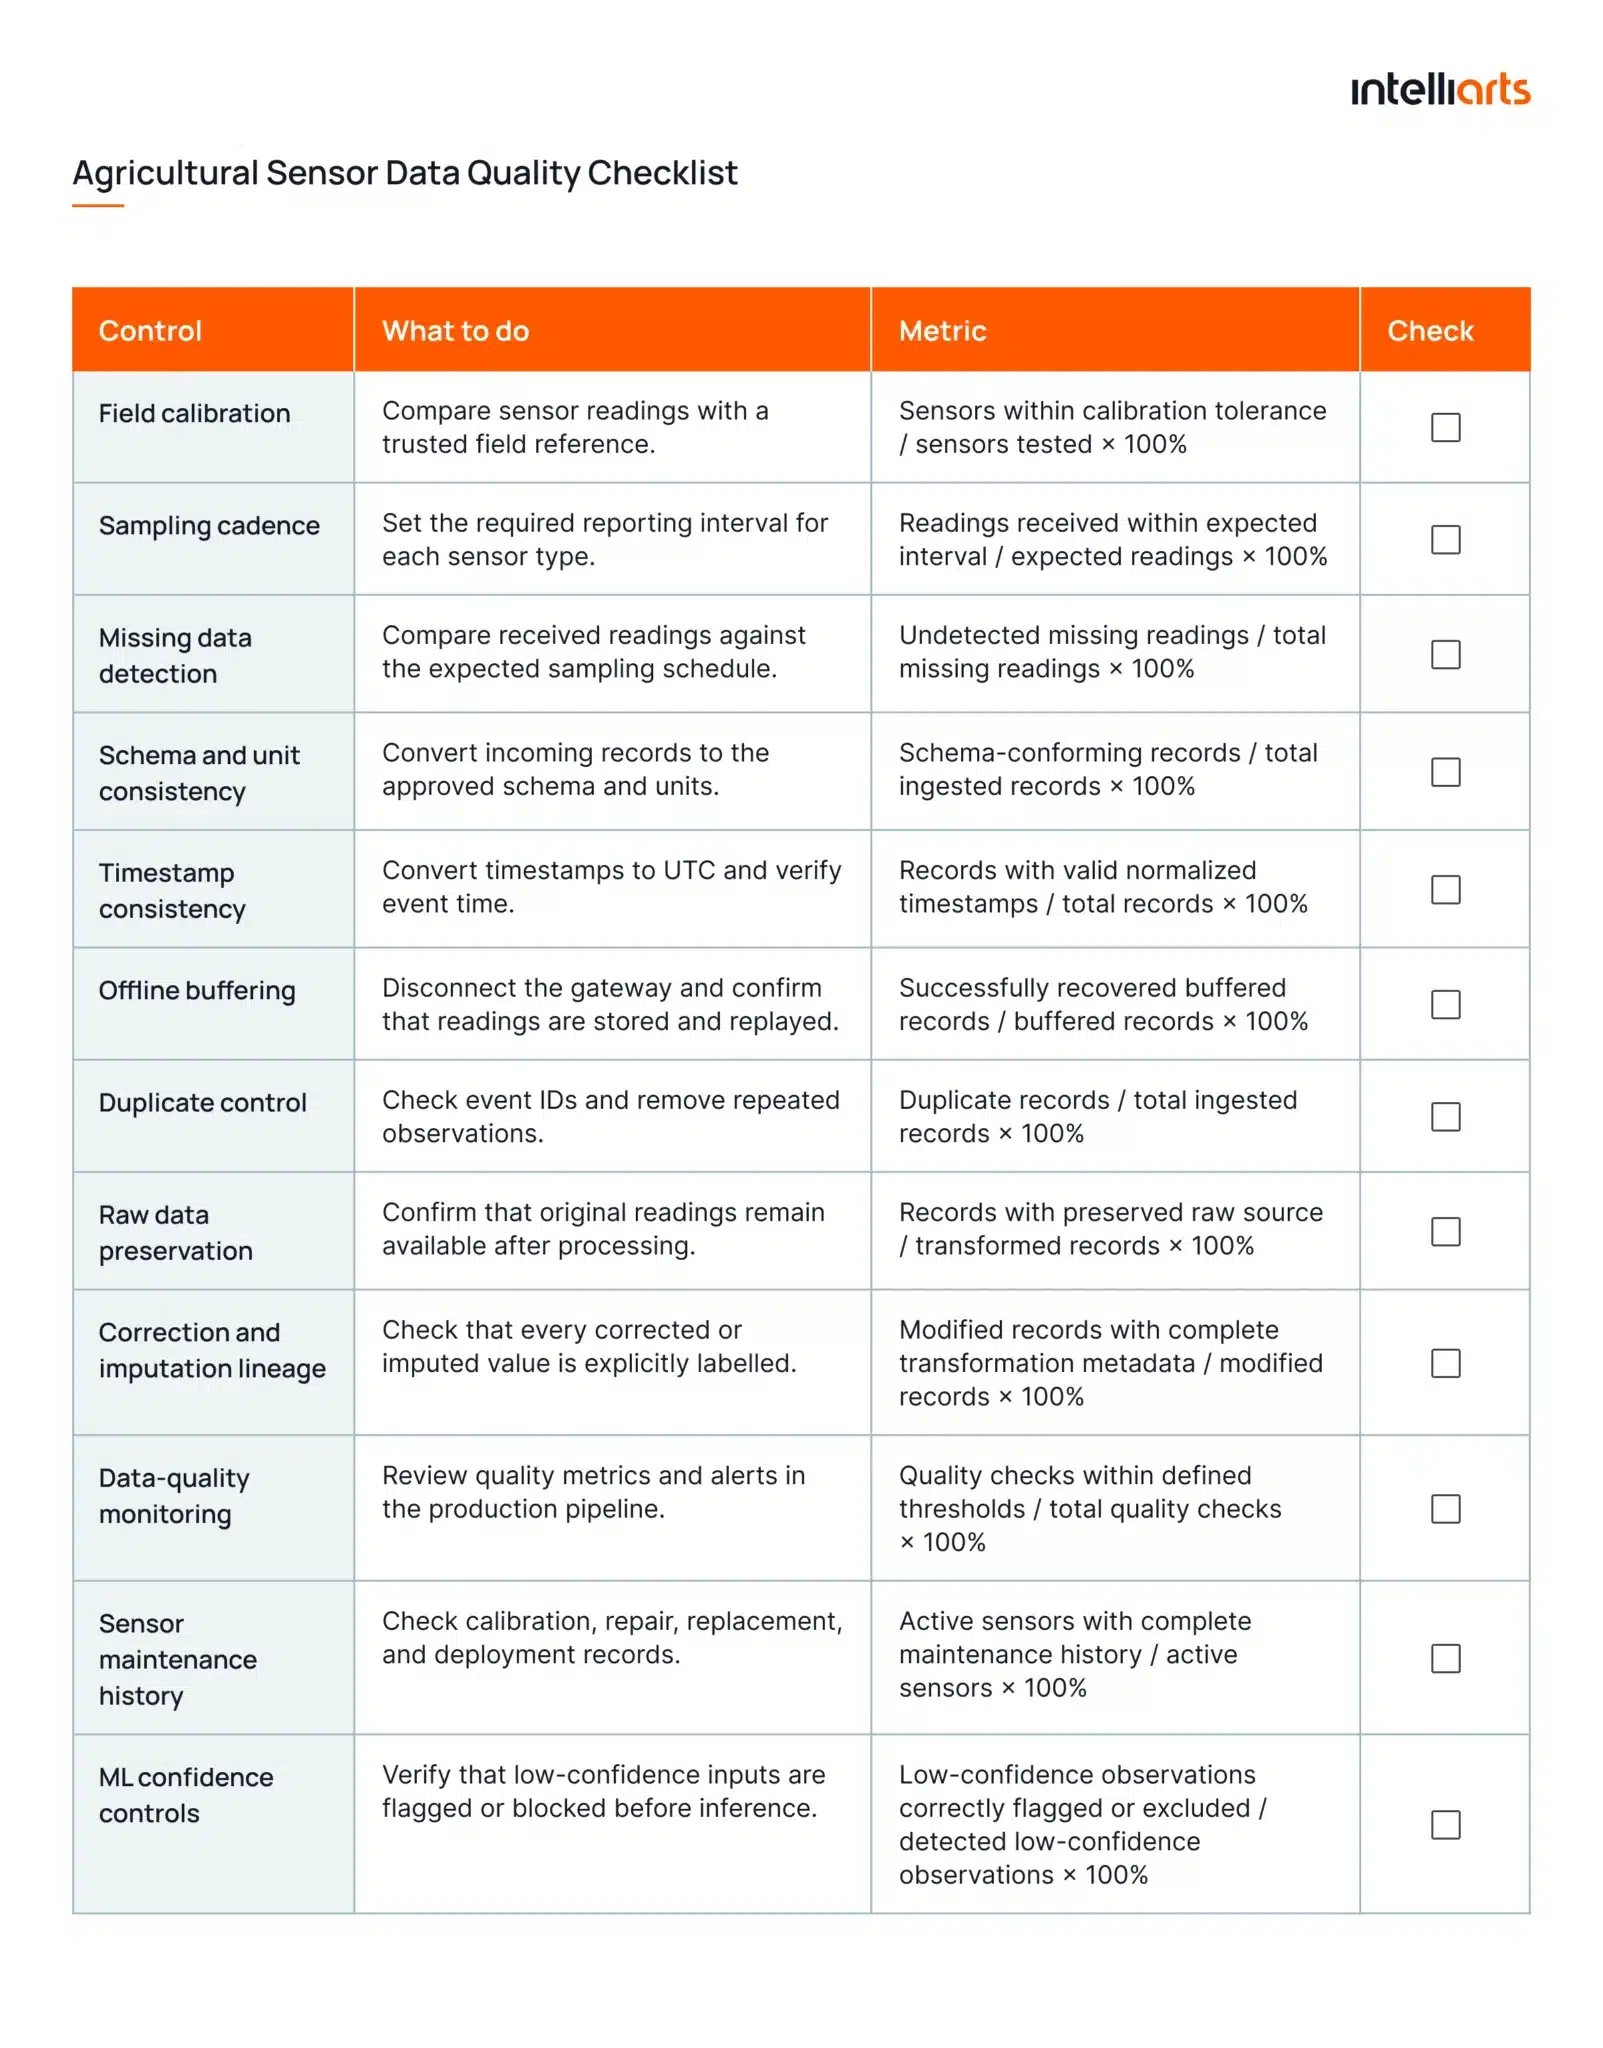
Simply print it, or download it and open it in a graphical editor of your choice. Conduct the assessment, record the relevant metrics, and check off each completed item. This will give you a clear, practical view of your sensor data quality across the pipeline:
How Intelliarts helps improve agricultural IoT data pipelines
Intelliarts has 27 years of software engineering experience and 90+ large-scale projects, with expertise in agritech, data engineering, and machine learning.
Our agriculture portfolio covers sensor management, field-data automation, land sampling, analytics, and ML-powered products. Our expertise also covers custom AI development for products that depend on production-grade ML.
Before defining architecture, we assess the factors that determine whether the product can scale in production: field-data quality, hardware constraints, legacy integrations, connectivity, seasonal workflows, and expected operating scale.
High-risk assumptions can be validated through discovery or a focused PoC before full development.
You can see how this approach works in practice across several Intelliarts agritech projects:
- Sensor management platform: The solution centralized nearly 2,000 sensors across 500 fields and added QA/QC and lifecycle management, supporting 260% operational scaling.
- Indigo Ag land-sampling automation: Intelliarts modernized and automated land-sampling workflows, reducing manual intervention and process delays.
- Field-data automation: The platform reduced data collection from weeks to minutes and helped expand coverage to 2.6M+ U.S. acres.
See more projects via the Intelliarts portfolio page.
If the next stage of your agritech product depends on better data, automation, or scalability, we can help define it, so don’t hesitate to reach out.
Final take
Reliable agricultural IoT starts with confidence in the data itself. Sensor readings must remain trustworthy as they move through the pipeline and into analytics or ML. Strong quality controls make failures visible before they distort downstream decisions.
They also preserve the context needed to trace anomalies back to their source and correct them without compromising the wider dataset.
Intelliarts brings 27 years of engineering experience and a track record of 90+ large-scale projects. In agritech, our software has supported 260% operational scaling and helped expand field-data coverage to 2.6M+ U.S. acres. Our average customer relationship lasts more than four years.
If you need an experienced partner for your next agritech initiative, contact us, and our experts will get back to you shortly.
Specialized software engineering assistance
If your agricultural IoT data pipeline needs better scalability or greater ML readiness, then you might use a specialized software engineering service
Talk to the Intelliarts experts
FAQ
What causes sensor data quality issues in agricultural fields?
Agricultural sensor data quality issues usually stem from unreliable measurements, transmission gaps, inconsistent formats, or processing errors. They can distort irrigation decisions, alerts, and predictive models unless the agricultural data pipeline validates each record before downstream use.
How can sensor calibration drift affect yield prediction models?
Sensor calibration drift can introduce systematic bias into yield prediction models, making forecasts less accurate over time. If uncorrected readings enter training data, the model may learn false relationships and perform poorly across seasons, fields, or soil conditions.
How should missing agricultural sensor data be handled?
Missing agricultural sensor data should be flagged, traced to its source, and backfilled only when reliable records become available. Any imputed value must remain clearly labeled so analytics and ML systems do not treat estimates as observed data.