
The value of business analytics has hardly ever been underestimated. Time series forecasting business covers trends that can be spotted over time. It’s one of the ways to analyze and make use of vast business data that companies gather during their daily operations.
Valued at $18.9 billion, the Analytics-as-a-Service (AaaS) market, which also covers forms of real-time time series analysis distributed as services, is projected to rise to $58 billion by the year 2027. It clearly shows the rising popularity of analytics in business, conducted by both external and in-house means.
In this post, you’ll discover real-time time series analysis, how it works, and which models are commonly used. You’ll also review six top time series data examples in businesses by famous companies.
Time series data examples
In our experience, real-world examples are the best way to show how time series analysis works in practice and what kind of business value it can create. Let’s review six top time series uses cases of companies across different business domains, highlighting an example of time series forecasting in business for each case:
#1 Time series in the electronic interconnect industry: Case of a manufacturing company

At Intelliarts, we’ve been working with time series data for over 5 years. This time our customer was a service provider in the electronic interconnect industry, known for manufacturing and distributing connectors, cables, optics, and more.
Case background: The company faced challenges in predicting demand and improving stock availability. To address this, the Intelliarts ML team developed a machine learning prediction and forecasting engine. This engine was designed to detect patterns in the manufacturer’s data and make accurate sales predictions, aiding in procurement forecasts.
Case outcomes: The implementation of this machine learning model enabled the Intelliarts’ customer to anticipate future purchasing needs, manage resources more efficiently, and reduce costs and waste, leading to improved operational efficiency.
Read also about predictive maintenance benefits in manufacturing.
#2 Time series in healthcare: Case of smart mattress startup under NDA

Our customer was a health tech company that offered smart mattresses that could monitor patients’ heart rate and respiratory rate.
Case background: Intelliarts helped apply time series analysis for early detection of respiratory complications by analyzing trends in heart rate and respiratory rate data collected by smart mattresses. Using a time series binary classification model with gradient boosting, the company aimed to predict complications 7–10 days before onset, focusing on achieving high Sensitivity while maintaining Specificity above 0.95.
Case outcomes: The model successfully achieved 47% Sensitivity with Specificity over 0.95, enabling early identification of nearly half of potential complications with minimal false alarms. This time series analysis case study confirms the feasibility of using the technology in smart healthcare devices to enhance patient monitoring and preventative care.
#3 Time series in e-mobility: Case of EV Connect

Our partner was an EV charging solutions provider offering a network of charging stations with 24/7 service support.
Case background: The company faced a challenge of unexpected charger downtime and limited visibility into equipment behavior. To address this, our team analyzed historical EV charger data, collected via OCPP logs and charging sessions. We used real-time time series analysis and anomaly detection techniques.
The goal was to identify patterns in charger behavior over time, detect anomalies, including unusually long charging sessions, and prepare data for a machine learning–based predictive maintenance IoT system.
Case outcomes: The analysis provided deep insights into charger usage patterns, system performance, and failure indicators. Intelliarts identified abnormal behavior clusters and key anomalies, helping the company better understand the root causes of downtime. We also improved data quality, structured raw time-series data for ML use, and delivered recommendations for building a scalable predictive maintenance IoT solution.
Interested in implementing a time series analysis solution in your business and enhancing it with AI? Drop Intelliarts a line, and let our expert data engineers contribute to your best project.
#4 Time series in the financial sector: Case of Goldman Sachs
Goldman Sachs is a leading global investment banking, securities, and investment management firm. It’s known for its expertise in market risk management.
Case description: Goldman Sachs employed time series analysis in market risk management, particularly for Value at Risk (VaR) modelling, which estimates potential portfolio losses. A real-life example of time series data could be the analysis of daily stock prices or market volatility. This approach enabled Goldman Sachs to quantify the level of financial risk associated with their investment portfolios and make informed decisions to mitigate potential losses.
Case outcomes: The use of time series analysis enabled Goldman Sachs to better manage market risk and make informed investment decisions. The firm’s VaR modelling has been noted to average record levels, highlighting its significance in its risk management strategy.
Thinking about time series analysis for your business?
Intelliarts helps implement the right tailored solution for your needs.
Let's talk
#5 Time series in the energy sector: Case of National Grid
National Grid is an electricity and gas utility company responsible for energy transmission and distribution.
Case description: In this time series analysis case study, National Grid applied time series analysis for electricity demand forecasting, crucial for grid stability and energy distribution planning. By predicting the electricity demand, National Grid could ensure that there was a sufficient supply of energy to meet the needs of consumers and businesses.
Case outcomes: Enhanced grid stability and optimized energy distribution achieved through the time series use cases show a positive impact on ensuring reliable electricity supply and preventing blackouts.
#6 Time series in aviation: Case of EasyJet
EasyJet is a European low-cost airline operating a fleet of over 300 aircrafts across domestic and international routes.
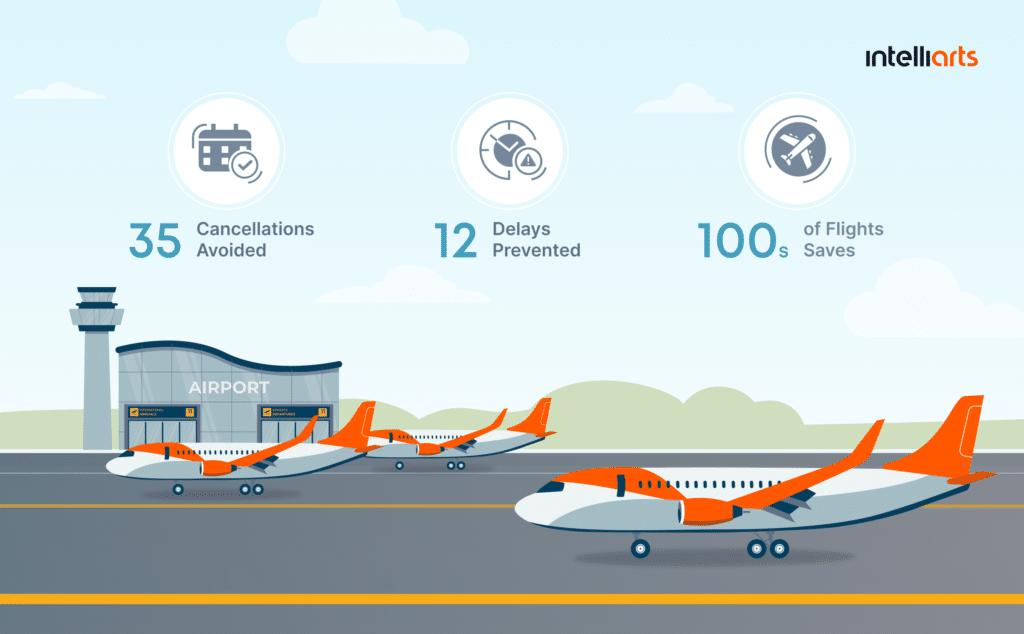
Case description: EasyJet employs time series–based predictive analytics to improve aircraft maintenance and reduce operational disruptions. By analyzing historical flight data and sensor signals over time, the company uses predictive models to detect anomalies and identify early signs of component failure. With machine learning for time series, EasyJet increased the number of monitored parameters from around 390 to up to 24,000. This significantly improved their ability to track equipment behavior and predict issues in advance.
Case outcomes: The use of real-life time series data and analysis helped EasyJet to avoid 35 flight cancellations and 12 delays in a single month. Overall, the approach has already prevented hundreds of cancellations and major delays, which also reduced maintenance inefficiencies.
Models for time series forecasting business
Based on our experience building forecasting and predictive analytics solutions, we discuss what models are used to analyze and forecast real-time time series data. Here we distinguish between classical vs foundation and deep learning models.
But first let’s familiarize with an example of what two-year time series analysis can look like in the chart below:
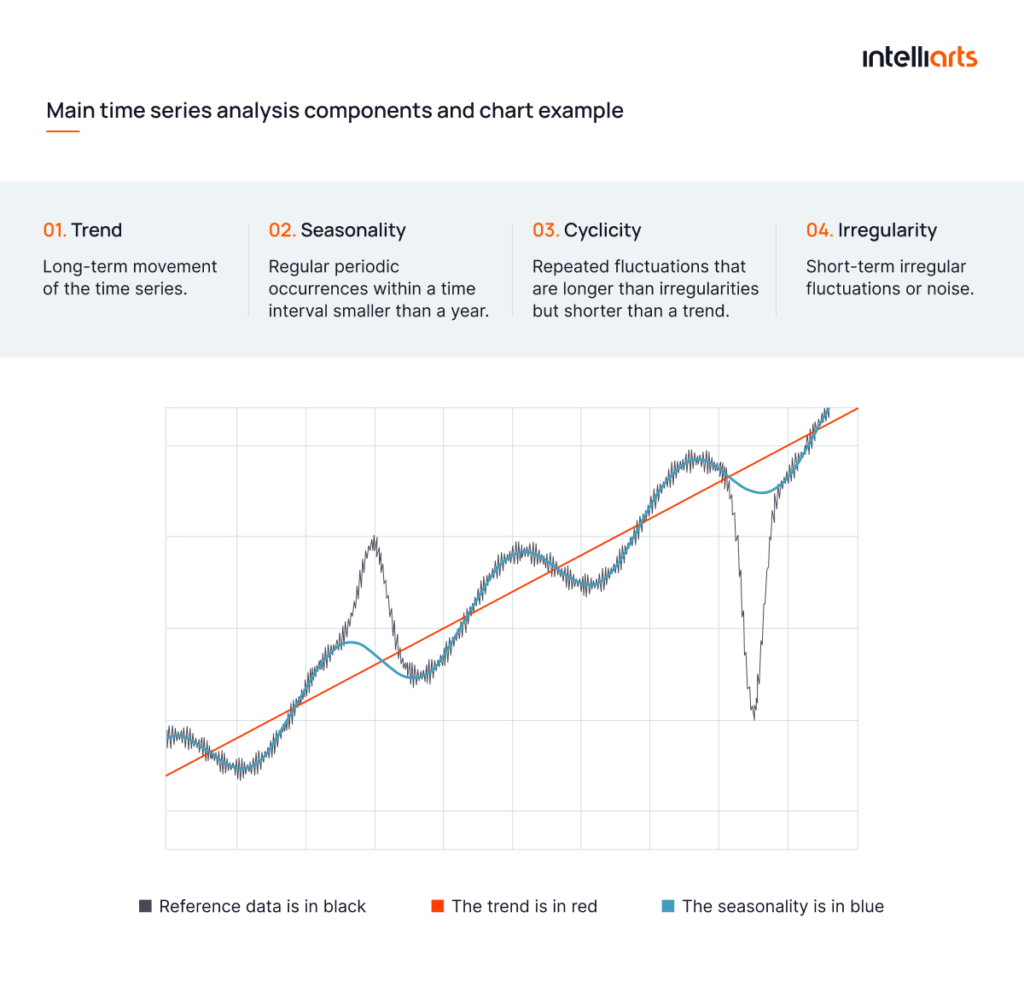
Source: Timescale.com
In the infographic, the reference data is colored black, the trend is colored red, and the seasonality is colored blue. You can observe cyclic fluctuations, and two large irregularities complete the decomposition. This graphic can be typical for the demand for seasonal goods and products, such as clothing.
Classical time series models
Classical or traditional time series models are designed to analyze patterns within a specific dataset. They are widely used for their interpretability, stability, and strong performance on structured data with clear seasonality and trends. Common models include:
1. ARIMA (Autoregressive Integrated Moving Average)
Key principles: Combines autoregressive (AR) and moving average (MA) models with differencing to make the time series stationary. It is characterized by three parameters: p (autoregressive order), d (degree of differencing), and q (moving average order).
Despite the rise of deep learning, recent research confirms that ARIMA remains a strong baseline model for structured, low-noise datasets with clear temporal patterns. Modern benchmarking studies show its competitive advantage in scenarios with limited data and lower complexity.
“In real-world time series projects, model choice is rarely about picking the most advanced algorithm. It’s about matching data characteristics to the right level of complexity. In many cases, a well-tuned classical model like ARIMA or SARIMA outperforms deep learning simply because the data is structured and limited.” – Volodymyr Mudryi, Data Scientist at Intelliarts

Example of ARIMA forecast residual time series and histogram for the residual distributions.
If we compare ARIMA vs LSTM (Long Short-Term Memory) as a deep learning approach, ARIMA typically performs better on smaller, structured datasets. Meanwhile, LSTM models tend to outperform ARIMA in capturing complex, non-linear patterns in large-scale time series.
Application: Univariate time series with trend and without seasonal components.
2. SARIMA (Seasonal ARIMA)
Key principles: Extends ARIMA by adding seasonal terms to handle seasonality in the data. It includes additional seasonal parameters: P (seasonal autoregressive order), D (seasonal differencing degree), Q (seasonal moving average order), and s (seasonal period).
SARIMA achieves robust performance in seasonal forecasting tasks such as epidemiology, energy, and transportation. A 2025 study on aviation forecasting demonstrated that a SARIMA model reached approximately 4.5% MAPE and produced reliable short-term predictions for passenger traffic.
Application: Time series with both trend and seasonality
3. Holt-Winters (Exponential Smoothing)
Key principles: Applies exponential smoothing to capture level, trend, and seasonal components in data, a common seasonal time series application with real data. It uses three smoothing parameters: α (level), β (trend), and γ (seasonality).
Holt–Winters remains a reliable approach for short-term forecasting in datasets with stable seasonal patterns. For example, a 2025 study on agricultural price forecasting demonstrates that Holt–Winters effectively captures trend and seasonality, with the multiplicative version providing more accurate results in the presence of changing seasonal intensity.
Application: Time series with trend and seasonality, especially when the data is relatively stable and the seasonal pattern is consistent.
4. VAR (Vector Autoregression)
Key principles: A multivariate extension of the AR model, capturing the linear interdependencies among multiple time series. Each variable is modeled as a linear combination of its own past values and the past values of other variables.
VAR and its extensions remain effective tools for modeling complex economic systems with multiple interacting variables. A 2025 study on inflation forecasting shows that VAR-based models incorporate both domestic and external drivers, such as money supply, GDP, exchange rates, and foreign inflation.
Application: Multivariate time series analysis, such as analyzing the relationship between economic indicators.
5. GARCH (Generalized Autoregressive Conditional Heteroskedasticity)
Key principles: Models the conditional variance (volatility) of a time series as a function of its own past values and past variances. It is characterized by parameters p (order of the autoregressive term) and q (order of the moving average term).
GARCH is widely used in financial analytics to model volatility clustering, periods of high and low variability in asset prices. A 2025 study in high-frequency trading environments proves its ability to model dynamic volatility patterns in real-world financial data.
Application: Financial time series with volatility clustering.
In our experience, these methods used in time series analysis can be applied simultaneously as part of a comprehensive time series strategy to provide several outcomes that will verify each other’s correctness and provide a broader picture.
Are you looking for a trusted provider to help you implement an AI-based time series analysis solution for your business? Drop Intelliarts a line, and let’s discuss opportunities.
Foundation models
Foundation models are pre-trained on large-scale temporal datasets and can generalize across different domains with minimal fine-tuning. Unlike classical methods that are typically built for a single dataset, these can learn patterns across multiple time series and adapt to new forecasting tasks more efficiently. This makes them particularly valuable for complex and high-volume environments.
Some of the most notable models include:
1. TimeGPT
Key principles: TimeGPT is a foundation model for time series developed by Nixtla. It is trained on large-scale temporal data and designed to perform zero-shot and few-shot forecasting without extensive retraining. The model captures global patterns such as trends, seasonality, and anomalies across diverse datasets.

TimeGPT was trained in the largest collection of publicly available time series and can forecast unseen time series without re-training its parameters.
The model was trained on over 100+ billion data points across domains including finance, energy, healthcare, and IoT. This allows it to forecast unseen time series without retraining and significantly reduces the need for manual feature engineering and model tuning.
Application: Forecasting across multiple domains (finance, retail, energy) with minimal setup, especially when historical data is limited or fragmented.
2. Chronos
Key principles: Chronos is a transformer-based time series model by Amazon that treats forecasting as a sequence modeling problem. It uses tokenization of time series data and is pre-trained on a large corpus of public datasets.
Research shows that transformer-based models such as Amazon Chronos can significantly improve zero-shot forecasting accuracy across diverse datasets. It also reduces the need for task-specific training.
Application: Large-scale forecasting tasks, including demand prediction, anomaly detection, and probabilistic forecasting.
3. Moirai
Key principles: A modern foundation model by Salesforce designed for probabilistic time series forecasting across domains. It uses large-scale pretraining to generalize patterns and provide uncertainty-aware predictions.
The model is based on a masked encoder transformer and trained on the Large-scale Open Time Series Archive (LOTSA), which contains over 27 billion observations across nine domains.
Application: Cross-domain forecasting and enterprise-scale prediction tasks.
Deep learning models
Deep learning models are designed to capture complex, non-linear relationships in time series data. Unlike foundation models, they are typically trained on specific datasets but can model interactions between multiple variables and learn long-term dependencies.
These models are particularly effective for high-dimensional data and scenarios where multiple external factors influence outcomes.
Learn more about deep learning for predictive models in another of our blog posts.
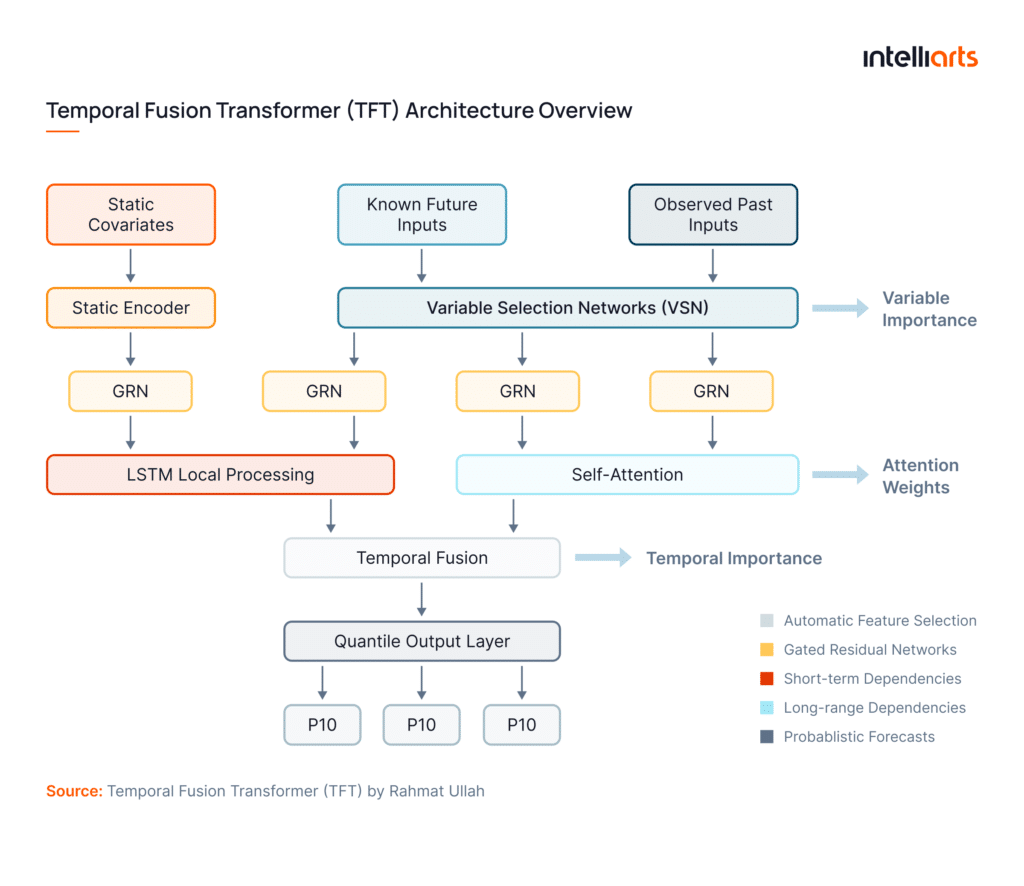
1. TFL (Temporal Fusion Transformer)
Key principles: TFT is a deep learning model specifically designed for interpretable multi-horizon time series forecasting. It combines recurrent layers with attention mechanisms to capture both short-term dynamics and long-term dependencies, while also highlighting which variables are most important for predictions.
Research proves the strong performance of TFL in capturing complex temporal relationships in real-world scenarios, including energy demand forecasting and financial modeling. Also, recent applications show that TFL remains highly effective in environments with multiple external variables, outperforming traditional models in multi-horizon forecasting tasks.
Application: Complex forecasting scenarios with multiple inputs (e.g., pricing, weather, promotions), such as retail demand forecasting or energy consumption modeling.
2. N-BEATS (Neural Basis Expansion Analysis for Time Series)
Key principles: The model uses a deep neural architecture with residual connections to model trend and seasonality without predefined assumptions. It learns interpretable components directly from data.
N-BEATS remains one of the most effective architectures for capturing complex temporal patterns due to its modular design and ability to model nonlinear relationships without feature engineering. Additionally, research applying N-BEATS to real-world domains, such as agriculture and energy forecasting, demonstrates its flexibility and strong predictive performance across diverse datasets.
Application: High-accuracy forecasting for sales, demand, and financial data.
3. DeepAR
Key principles: This is a probabilistic forecasting model based on autoregressive recurrent neural networks. It learns patterns across multiple related time series and produces forecasts.
Research highlights the effectiveness of this method in real-world applications such as retail demand, finance, and logistic forecasting, as well as energy load prediction. In these scenarios, probabilistic outputs help businesses make more robust decisions under uncertainty. Also, the algorithms like DeepAR remain a strong baseline for multi-series forecasting, particularly in scenarios with large datasets and shared temporal patterns.
Application: Demand forecasting, inventory planning, and large-scale prediction tasks.
Forecasting methods vs business use cases
Different forecasting approaches are suited for different types of data and business goals. The table below summarizes which methods work best depending on the use case, data complexity, and scale.

Forecasting methods vs business use cases
Our team’s experience proves that in practice, the most effective forecasting systems combine multiple approaches. For example, businesses can use classical models for baseline predictions and foundation models to improve accuracy and scalability across large datasets.
“A good forecast is the one that actually supports a business decision. In production, we often trade a bit of accuracy for interpretability and faster iteration. – Volodymyr Mudryi, Data Scientist at Intelliarts
Final take
Time series analysis is a powerful statistical tool used to forecast future trends, manage risks, optimize inventory, and enhance decision-making. By leveraging time series models, businesses can gain insights into patterns and seasonality in their data, leading to improved operational efficiency and competitive advantage. Implementing time series analysis, especially with AI enhancements, can significantly benefit companies in finance, retail, energy, technology, and telecommunications.
Implementing a time series solution in business, automating it, and enhancing it with AI capabilities, require substantial experience and expertise. The right call is to entrust your project to qualified engineers. Consider Intelliarts data engineering consultants, we deliver cutting-edge and data-driven software solutions for over 24 years.
FAQ
What are the main objectives of time series analysis?
The main objectives of time series analysis are to understand the underlying structure and behavior of data, identify patterns such as trends and seasonality, forecast future values, and make informed decisions based on the analysis.
What is time series forecasting?
Time series forecasting is a statistical technique used to predict future values based on previously observed values. It involves analyzing time series data to identify patterns and trends, which are then used to forecast future data points. Common time series data examples include sales figures recorded monthly, daily website traffic, or seasonal energy consumption patterns.
How does time series analysis enhance financial risk management?
Time series analysis helps in modeling and forecasting market volatility. By analyzing historical financial data, firms can identify potential risks and devise strategies to mitigate them, ensuring more stable financial performance.


![Data Preprocessing in Machine Learning [6 Best Practices]](https://intelliarts.com/wp-content/uploads/2024/03/empowering-innovations-data-science-digital-technology-smart-officesxa-1-1.png)